Install Nginx Amplify on CentOS 8/RHEL 8 to Monitor LEMP Performance
Nginx Amplify is a free, flexible and powerful way to analyze the load and performance of Nginx and Nginx Plus web servers. It’s easy to set up and use. Nginx Amplify also comes with MySQL/MariaDB, PHP-FPM plugins so you can monitor a full LEMP stack application. (LEMP stands for Linux, Nginx, MySQL/MariaDB, PHP.)
Nginx Amplify is developed by Nginx, Inc, the company behind Nginx web server. It’s a SaaS-based solution. You install the Nginx Amplify agent on your server and it will collect and send metrics to the SaaS service. The Nginx Amplify agent is open-source and lightweight. It collects many metrics, including:
- System metrics (CPU, RAM usage, network traffic, disk usage, disk I/O, disk latency, etc)
- Nginx metrics (connections, requests, HTTP status, response time, traffic, and more)
- MySQL/MariaDB metrics (connections, select queries, insert queries, update queries, slow queries, etc)
- PHP-FPM metrics (connections, connections queue, slow requests, etc)
Nginx Amplify can also
- Use static analyzer to help you improve Nginx configuration.
- Alert you of abnormal behavior
Installing Nginx Amplify on Your CentOS 8/RHEL8 Linux Server
The Nginx Amplify agent is open-source and there’s an install script you can use to install Nginx Amplify on the following Linux Distributions:
- Debian 9, Debian 10,
- Ubuntu 16.04, Ubuntu 18.04
- CentOS /RHEL 6, CentOS/RHEL 7, CentOS/RHEL 8
First, register an account at https://amplify.nginx.com
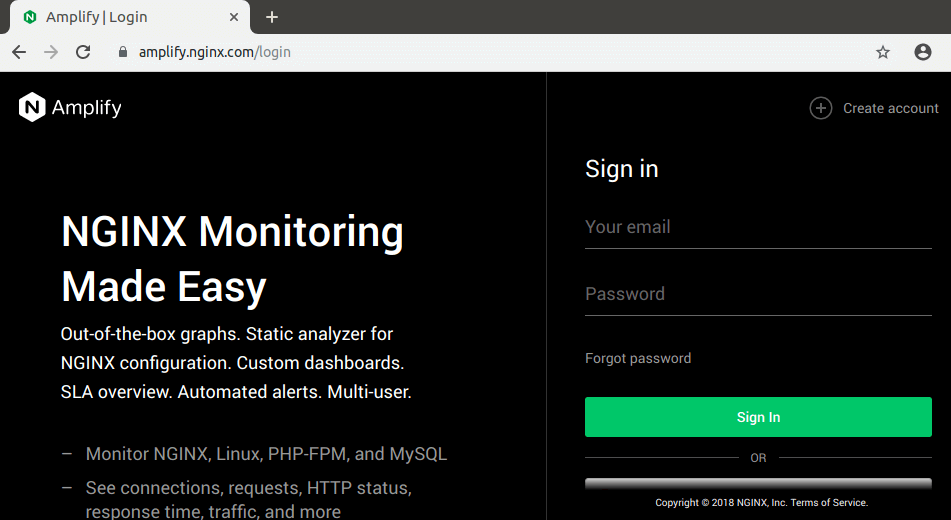
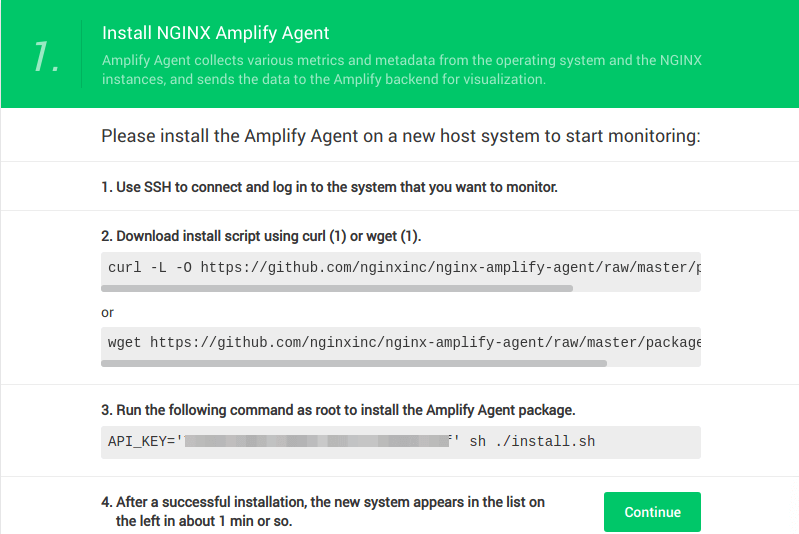
Verify your email address. Next, you will need to install the Nginx Amplify Agent on your Linux server. SSH into your server and login as root. The Nginx Amplify website is very nice to give the commands you need to run to install Nginx Amplify, so just copy and run these commands on your server.
Note that you need to run these commands as root.
Nginx Amplify requires Python2. Install it from the default CentOS repository.
sudo dnf install python2
Download the install script.

Then run the install script. (Each Amplify account has a unique API key.)

Once it’s installed, the agent will automatically start. You can check its status with:
systemctl status amplify-agent
Sample Output:
● amplify-agent.service - NGINX Amplify Agent
   Loaded: loaded (/usr/lib/systemd/system/amplify-agent.service; enabled; vendor preset: disabled)
   Active: active (running) since Fri 2020-06-12 02:38:09 EDT; 2min 49s ago
     Docs: https://amplify.nginx.com/docs/
  Process: 13768 ExecStart=/etc/init.d/amplify-agent start (code=exited, status=0/SUCCESS)
 Main PID: 13820 (amplify-agent)
    Tasks: 2 (limit: 5059)
   Memory: 48.0M
   CGroup: /system.slice/amplify-agent.service
           └─13820 amplify-agent
Hint: If the above command doesn’t quit immediately, press Q to gain back control of the terminal.
To enable auto-start at boot time, run
sudo systemctl enable amplify-agent
Configuring Stub_status in Nginx
Amplify agent can collect system metrics out-of-the-box. In order to collect Nginx metrics, you need to configure Nginx stub_status. Create a config file.
sudo nano /etc/nginx/conf.d/stub_status.conf
Add the following server block in the http {...} context.
server {
     listen 127.0.0.1:80;
     server_name 127.0.0.1;
     location /nginx_status {
        stub_status on;
	allow 127.0.0.1;
	deny all;
     }
}
Save and close the file. Then reload Nginx for the changes to take effect.
sudo systemctl reload nginx
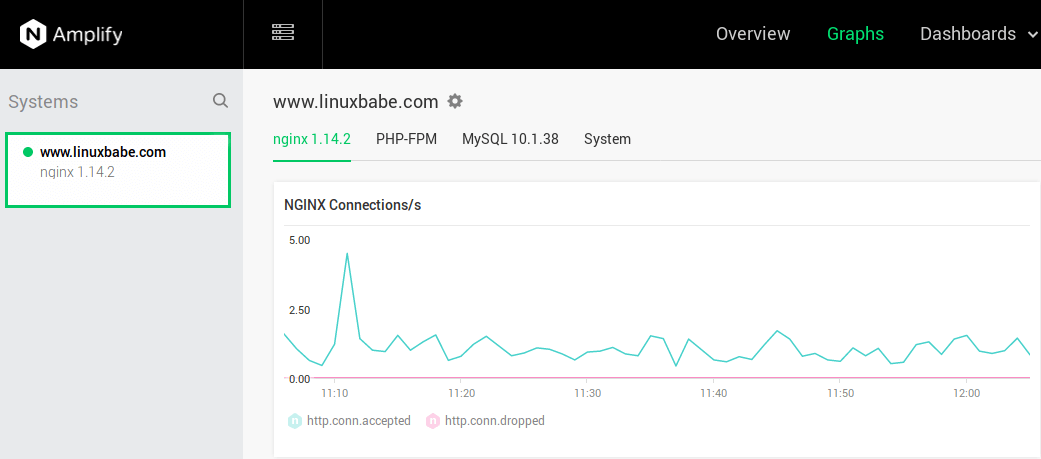
Now Amplify agent can start collecting Nginx metrics.
Creating Custom Nginx Log Format
Nginx Amplify agent can also collect information from Nginx log files. However, the default log format gives us limited information. If you really care about application performance, you should create a custom log format to show the request time, upstream response time, cache hits, etc.
Open the nginx.conf file.
sudo nano /etc/nginx/nginx.conf
Add the following lines in the http {...} context, above the include directives. Here we are creating a custom Nginx log format called apm (application performance monitoring) that includes information about request_time, upstream_response_time, upstream_connect_time and upstream_header_time. All are measured in seconds with millisecond resolution.
log_format apm '"$time_local" client=$remote_addr '
               'method=$request_method request="$request" '
               'request_length=$request_length '
               'status=$status bytes_sent=$bytes_sent '
               'body_bytes_sent=$body_bytes_sent '
               'referer=$http_referer '
               'user_agent="$http_user_agent" '
               'upstream_addr=$upstream_addr '
               'upstream_status=$upstream_status '
               'request_time=$request_time '
               'upstream_cache_status="$upstream_cache_status" '
               'upstream_response_time=$upstream_response_time '
               'upstream_connect_time=$upstream_connect_time '
               'upstream_header_time=$upstream_header_time';
Save and close file. Then open your Nginx virtual host configuration file. For example,
sudo nano /etc/nginx/conf.d/linuxbabe.com.conf
In the server {...} context, add the following two lines to enable access log and error log. The access log is using the apm format and error log uses the warn log level.
access_log /var/log/nginx/linuxbabe.com.access.log apm;
error_log /var/log/nginx/linuxbabe.com.error.log warn;
Save and close the file. Then reload Nginx.
sudo systemctl reload nginx
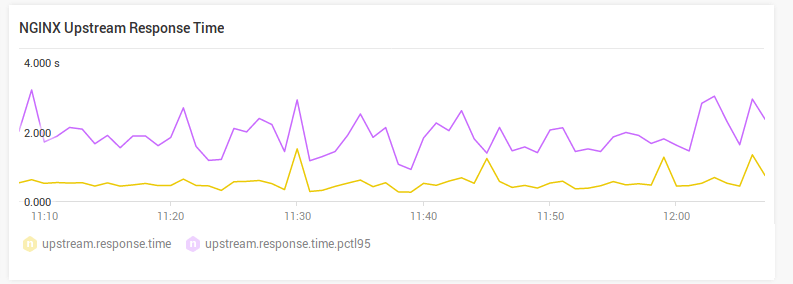
Now I can see the upstream response time and other performance related metrics in the Amplify graphs. A good upstream response time is below 0.5 seconds. Otherwise your visitors can feel your website is slow. If you can tune your server to get upstream response time below 0.2 seconds, your website will be very snappy.
If Amplify agent isn’t reporting Nginx metrics, check that Amplify agent runs as the same user as the Nginx worker process. You can also check the Amplify Agent log (/var/log/amplify-agent/agent.log).
How to Exclude Your Own IP Address in Nginx Access Log
Sometimes, your activity can skew the Nginx metrics. You can exclude your own IP address in the access log to avoid that. First, add the following lines in the http context of Nginx configuration file. Replace 12.34.56.78 with your own IP address. If the HTTP request comes from your own IP address, Nginx will set the value of $log_ip variable to 0.
map $remote_addr $log_ip {
    "12.34.56.78" 0;
    default 1;
}
Then change the access_log directive as follows.
access_log /var/log/nginx/linuxbabe.com.access.log apm if=$log_ip;
Save and close the file. Then text nginx configuration and reload.
sudo nginx -t
sudo systemctl reload nginx
How to Monitor MariaDB/MySQL Database Server
First, we need to create a user in MariaDB/MySQL to collect metrics. Log into MariaDB/MySQL monitor.
mysql -u root -p
Create a new user for Amplify agent. Replace your_password with your preferred password. (It’s recommended to choose a password that is different from the MariaDB/MySQL root password.)
create user 'amplify-agent'@'localhost' identified by 'your_password';
Exit MariaDB/MySQL server.
exit;
Next, we need to enable the Amplify MariaDB/MySQL plugin in the Amplify configuariton file.
sudo nano /etc/amplify-agent/agent.conf
In the [extensions] section, you can see that mysql plugin is disabled by default.
[extensions]
phpfpm = True
mysql = False
Change False to True to enable this plugin.
[extensions]
phpfpm = True
mysql = True
Then in [mysql] section, find the following line.
unix_socket = /var/run/mysqld/mysqld.sock
password = amplify-agent
The MariaDB package on CentOS listens on the /var/lib/mysql/mysql.sock Unix socket, so change the value of unix_socket to
unix_socket = /var/lib/mysql/mysql.sock
Then replace the default password with the password you set for the amplify-agent user. Save and close the file. Then restart Amplify agent for the changes to take effect.
sudo systemctl restart amplify-agent
Now Amplify agent starts collecting MariaDB/MySQL metrics. (You might need to wait a few minutes.)
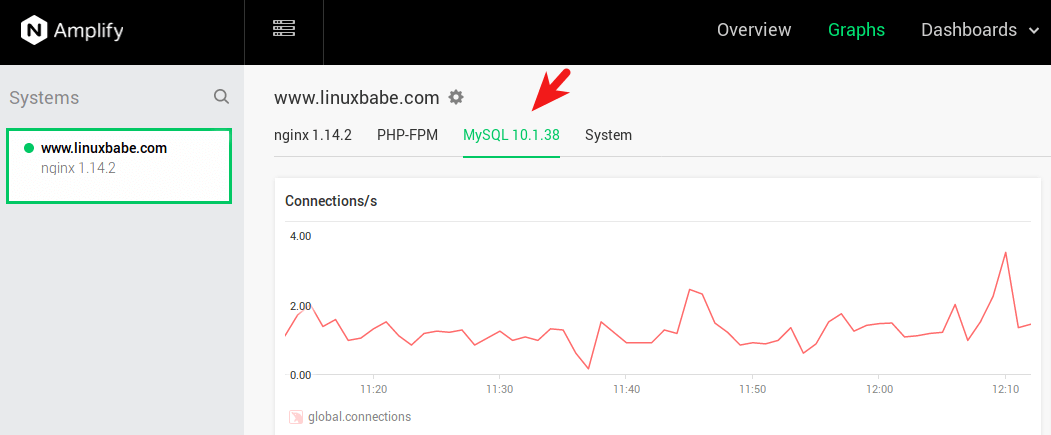
How to Enable MariaDB Slow Query Log
The slow query log can show you which queries are taking long time to give a response. It’s an important tool for optimizing MariaDB performance. To enable the MariaDB slow query log, edit the server configuration file.
sudo nano /etc/my.cnf.d/mariadb-server.cnf
Add the following lines in the [mysqld] section.
slow_query_log = 1
slow_query_log_file     = /var/log/mariadb/mariadb-slow.log
long_query_time = 1
log_slow_rate_limit    = 1000
log_slow_verbosity     = query_plan
log-queries-not-using-indexes
I set the long_query_time to a low number 1 second. You can also specify a smaller value like 0.5 second. Save and close the file. Restart MariaDB for the changes to take effect.
sudo systemctl restart mariadb
Now Nginx Amplify can show you slow queries in the graphs.
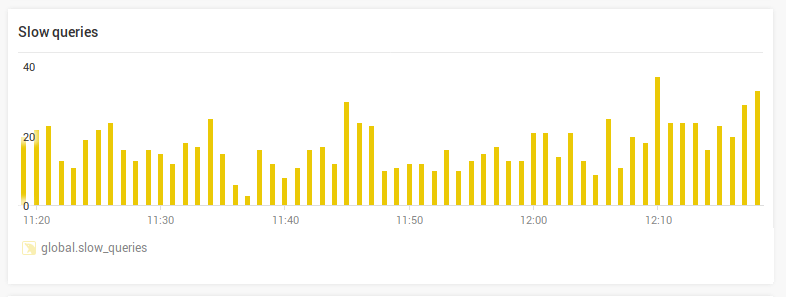
How to Monitor PHP-FPM
The Amplify agent PHP-FPM plugin is enabled by default, but we need to enable PHP-FPM status in order to collect metrics. Edit the PHP-FPM pool configuration file.
sudo nano /etc/php-fpm.d/www.conf
Find the following line and remove the semicolon to enable PHP-FPM status.
;pm.status_path = /status
The PHP slow log is enabled by default, as indicated by the following line.
slowlog = /var/log/php-fpm/www-slow.log
Then find the following line.
;request_slowlog_timeout = 0
Remove the semicolon and set the timeout seconds like 1s.
request_slowlog_timeout = 1s
Save and close the file. Create a directory for PHP-FPM logs.
sudo mkdir -p /var/log/php-fpm/
Restart PHP-FPM for the changes to take effect.
sudo systemctl restart php-fpm
Now Amplify agent starts collecting PHP-FPM metrics including the slow requests log.
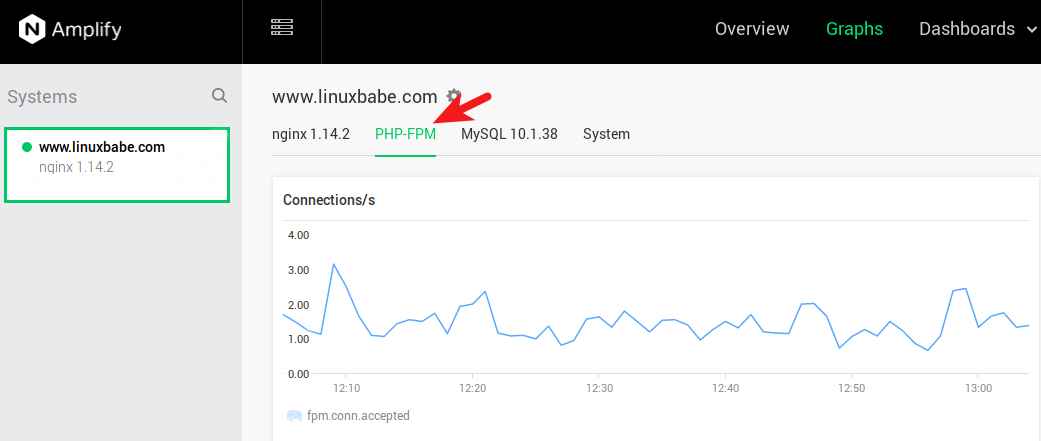
The Amplify Overview Page
On the overview page, you can see the overall application health score and 5 key metrics for your system.
- Total requests
- HTTP 5xx errors
- Request time (You need to create custom log format as described earlier to show this metric.)
- How much bandwidth Nginx uses
- CPU usage
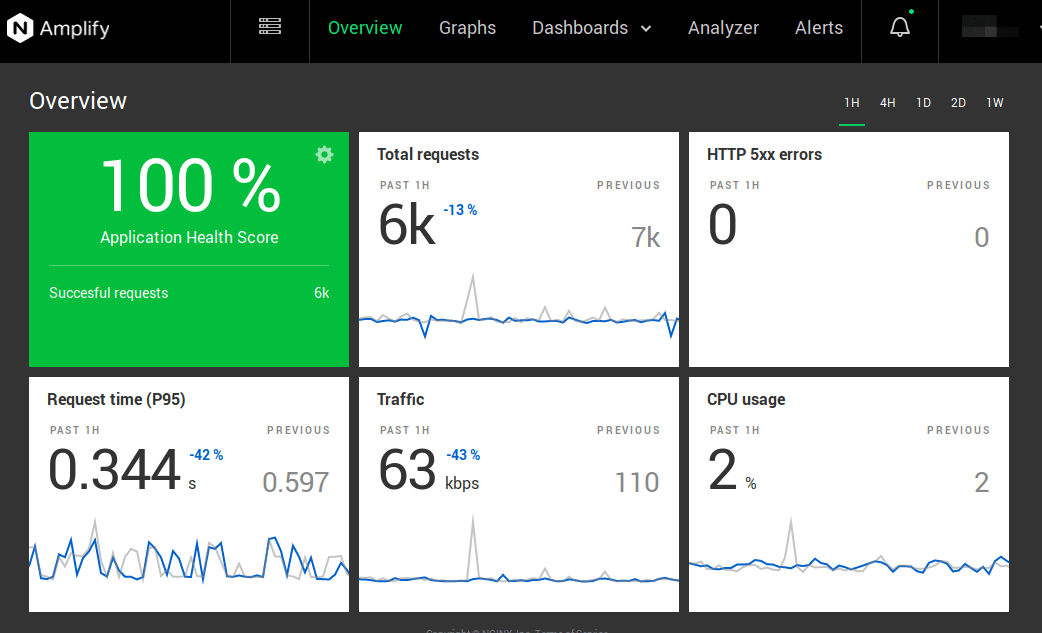
The application health score is affected by the number of HTTP 5xx errors. If there are no HTTP 5xx errors, then the score will be 100%.
Graphs
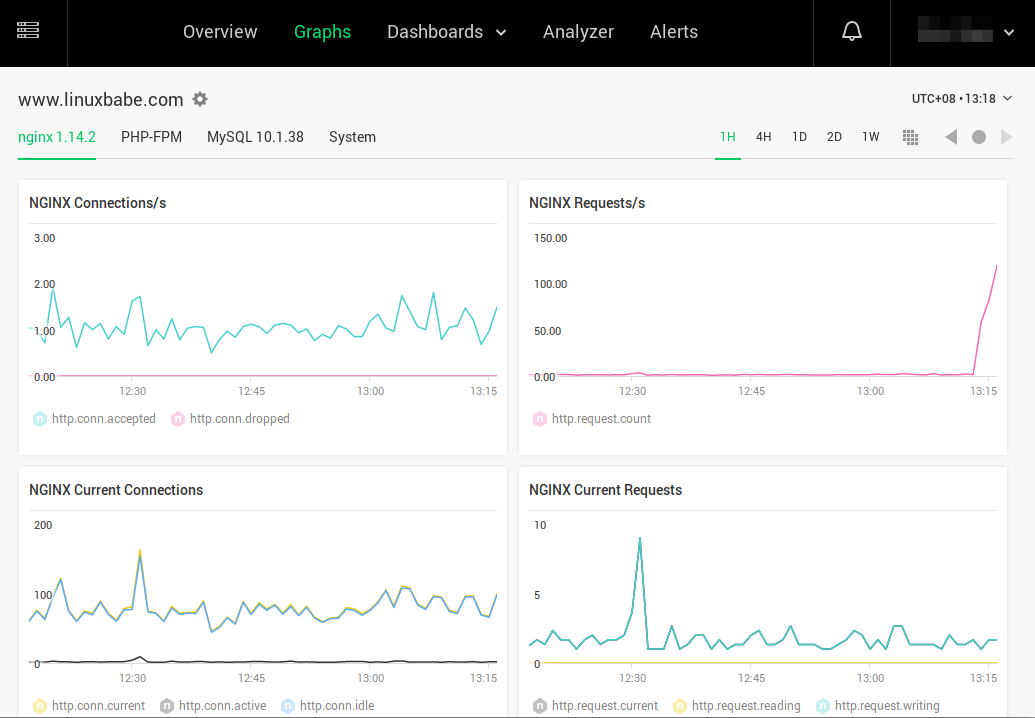
In the Graphs page, you can see predefined system, Nginx, MariaDB/MySQL and PHP-FPM metrics.
Nginx Amplify Dashboards
Amplify dashboards allow you to create custom graphs and charts and group them on one page. For example, you can assemble all performance related graphs on one page, or maybe you want to display all metric for a particular URL.
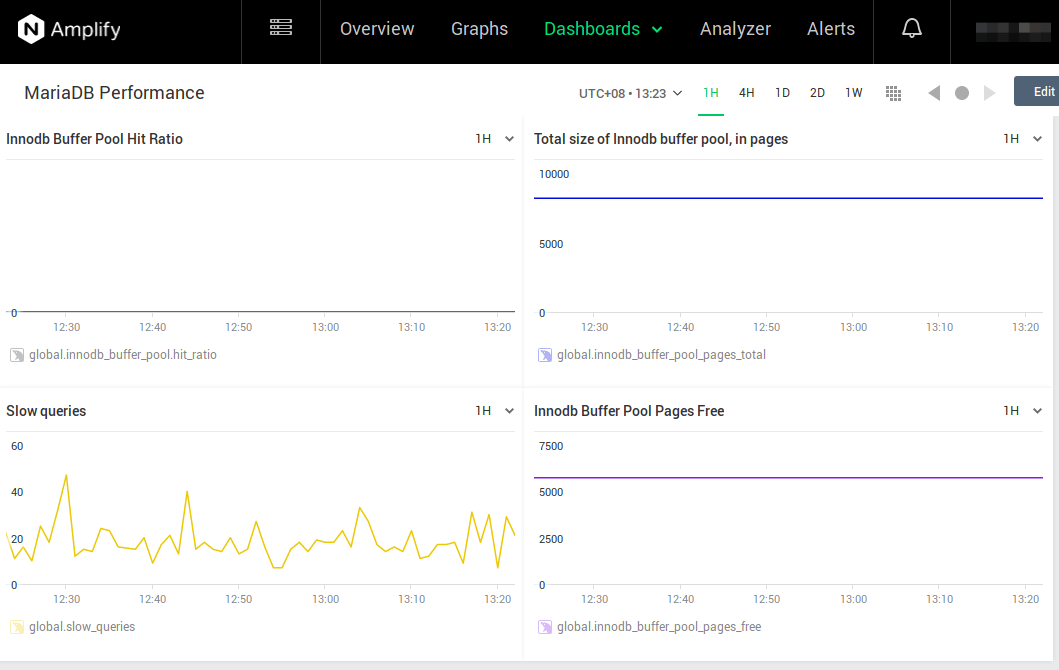
If you have configured Nginx FastCGI cache, you can also create graphs for Nginx cache hit ratio and cache expiration in the dashboard.
Analyzer
One of the useful tools in the analyzer is static analysis. Amplify can parse your Nginx configuration file and make performance, security and reliability recommendations. You can use it to identify mistakes and improve configurations.
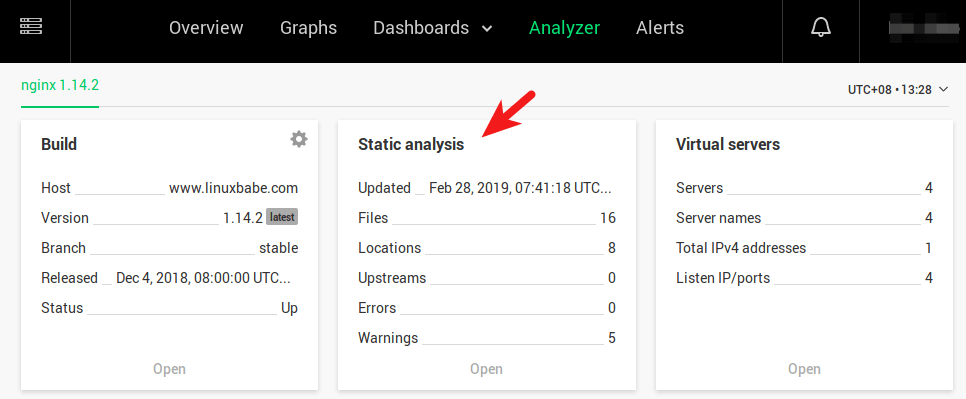
As you can see, there are 5 warnings for my Nginx server, so I click the Open link to see how to adjust my Nginx configurations.
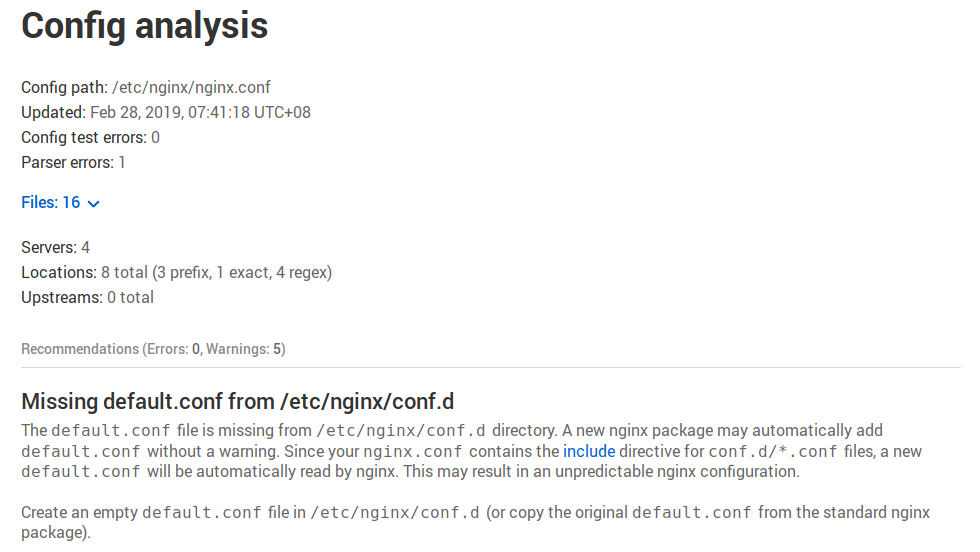
After making the adjustments, wait a few minutes and the warning will be gone.
Alerts
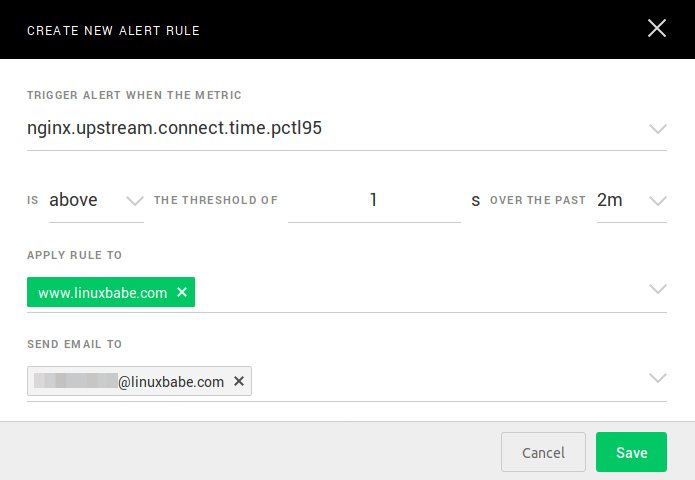
By default, if the Amplify agent stops working, an alert will be sent to your email address. On the alerts page, you can set various alerts for your server. For example, I can tell Amplify to send me an email if the upstream response time is above 1 second for the past 2 minutes.
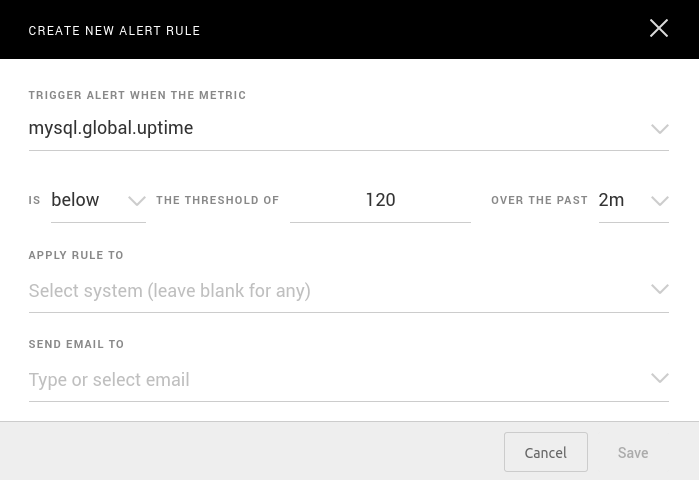
If your server runs of out RAM, then it could kill MySQL/MariaDB process. You can create an alert rule to monitor the MySQL/MariaDB uptime like below. If the uptime is below 120 seconds over the past 2 minutes, then send an email notification.
Amplify Agent Stops Working
Often I found that Amplify agent stops sending performance metrics for unknown reason. I create a Cron job to restart Amplify-agent once a day to solve this problem.
sudo crontab -e
Add the following line in the crontab file.
@daily systemctl restart amplify-agent
Save and close the file.
Wrapping Up
I hope this article helped you install and use Nginx Amplify to monitor performance of Nginx or LEMP stack applications on CentOS 8/RHEL 8. As always, if you found this post useful, then subscribe to our free newsletter to get more tips and tricks. Take care 🙂


Thank you! This is a wonderful tool that I knew nothing about.
Thanks Xiao for this excellent post. I don’t know this tool, and I am wondering why is not more popular.