Linux Server Performance Monitoring with Netdata (2022)
Netdata is an open-source real-time Linux server performance monitoring tool with a beautiful web front-end. It allows you to monitor CPU, RAM usage, disk I/O, network traffic, Postfix, among many others. Written in the C programming language, netdata is super fast and resource-efficient.
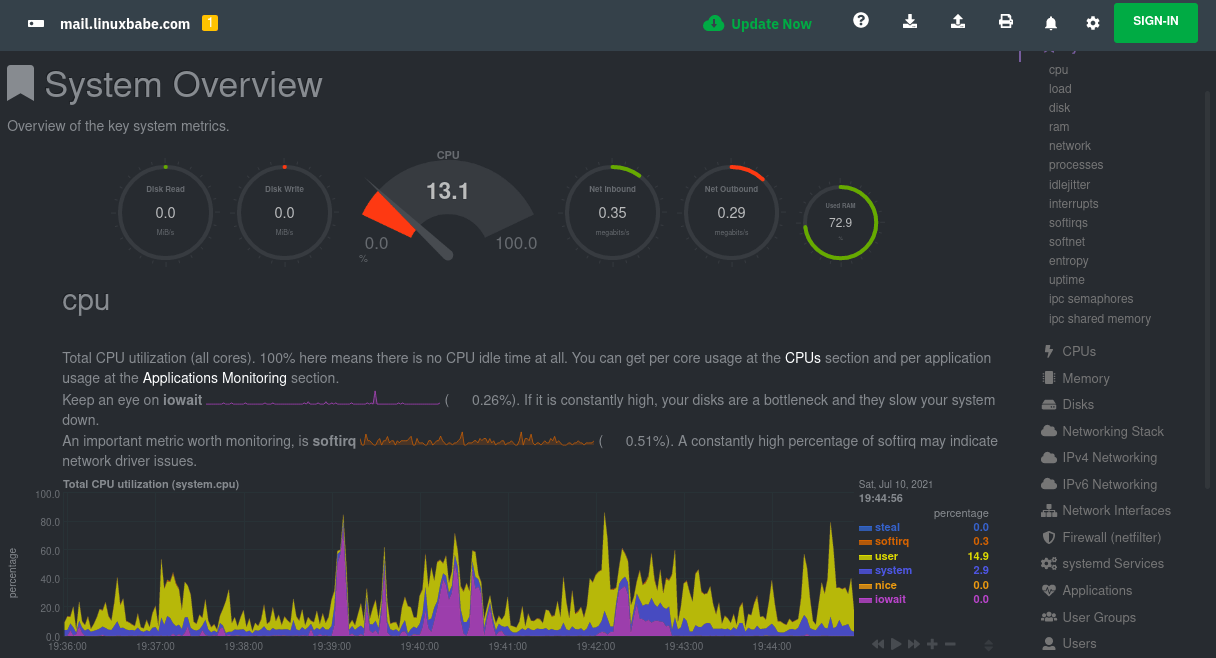
Netdata Features:
- It helps you instantly diagnose slowdowns and anomalies in your infrastructure with thousands of metrics, interactive visualizations, and insightful health alarms.
- 1s granularity – Netdata updates system statistics per second.
- Linux kernel insights via eBPF
- Parse Apache and Nginx web server logs to show you request processing time, upstream response time, and many other performance statistics.
- Collect database health and performance metrics (MySQL/MariaDB, PostgreSQL, MongoDB, etc), including Galera Cluster.
- Fast and lightweight – By default it uses only 1% CPU of a single core.
- and more.
In this tutorial, we are going to look at how to install netdata on Debian/Ubuntu and Redhat/CentOS/Fedora servers. We will also discuss how to enable password authentication on the netdata web interface so that only authorized users can have access to it.
Note: If you run a mail server with iRedMail, then you don’t have to follow this tutorial, because iRedMail automatically installed it for you. You can access Netdata web interface at https://mail.example.com/netdata/. You will need to enter your postmaster account and password.
Step 1: Install netdata on Linux Server
Netdata is included in many Linux distributions’ repositories. However, it’s probably not the latest version. To get the latest version, you can use the official netdata script to install the software. Simply run the following command on your Linux system.
bash <(curl -Ss https://my-netdata.io/kickstart.sh) --disable-telemetry
It might ask you to enter your password if you are not root.
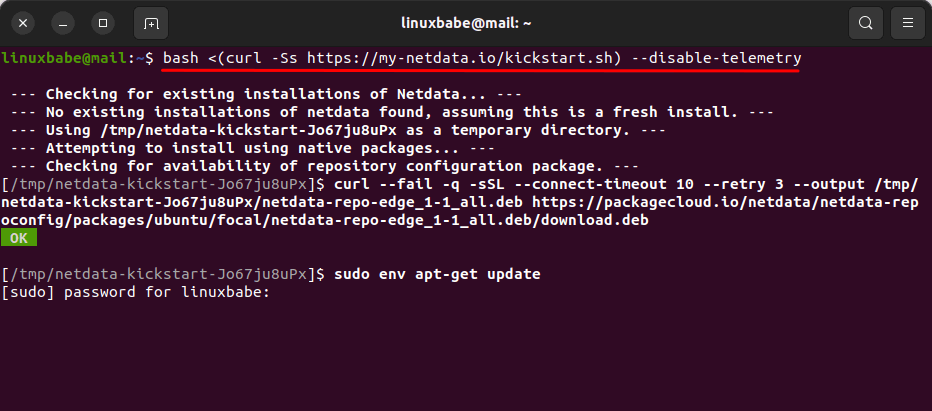
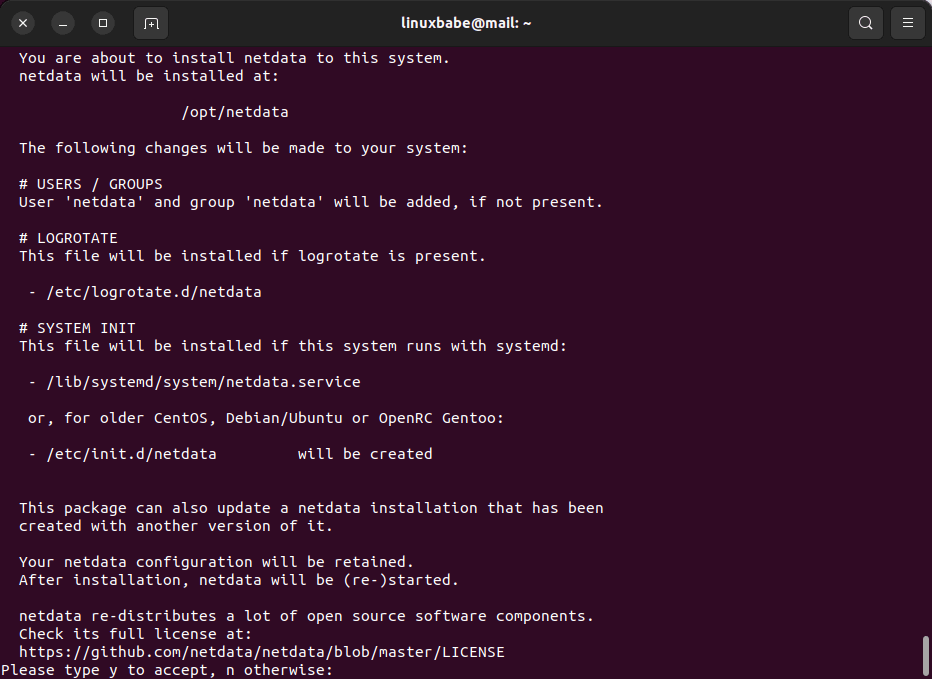
Then it will try to install dependencies if they are not already installed on your system. Next, it gives you a nice summary about where files will be installed to your system. Press y and Enter to start building and installation.
Once it’s installed, it should be automatically started and enabled auto start on system boot. As you can see with systemctl status.
systemctl status netdata
Sample output:
* netdata.service - Real time performance monitoring
     Loaded: loaded (/lib/systemd/system/netdata.service; enabled; vendor preset: enabled)
     Active: active (running) since Sat 2021-07-10 16:44:51 SAST; 18s ago
    Process: 1059965 ExecStartPre=/bin/mkdir -p /var/cache/netdata (code=exited, status=0/SUCCESS)
    Process: 1059977 ExecStartPre=/bin/chown -R netdata:netdata /var/cache/netdata (code=exited, status=0/SUCCESS)
    Process: 1059978 ExecStartPre=/bin/mkdir -p /var/run/netdata (code=exited, status=0/SUCCESS)
    Process: 1059979 ExecStartPre=/bin/chown -R netdata:netdata /var/run/netdata (code=exited, status=0/SUCCESS)
   Main PID: 1059980 (netdata)
      Tasks: 49 (limit: 38335)
If you can see the following lines in the output, don’t panic. Your installation is fine.
ebpf.plugin[1060201]: PROCFILE: Cannot open file '/etc/netdata/apps_groups.conf'
ebpf.plugin[1060201]: Cannot read process groups configuration file '/etc/netdata/apps_groups.conf'. Will try '/usr/lib/netdata/conf.d/apps_groups.conf'
Netdata by default listens on port 19999. Now enter server-ip:19999 in your browser address bar to access the netdata web interface. It doesn’t have an authentication mechanism. Anyone who knows your IP address can have access.
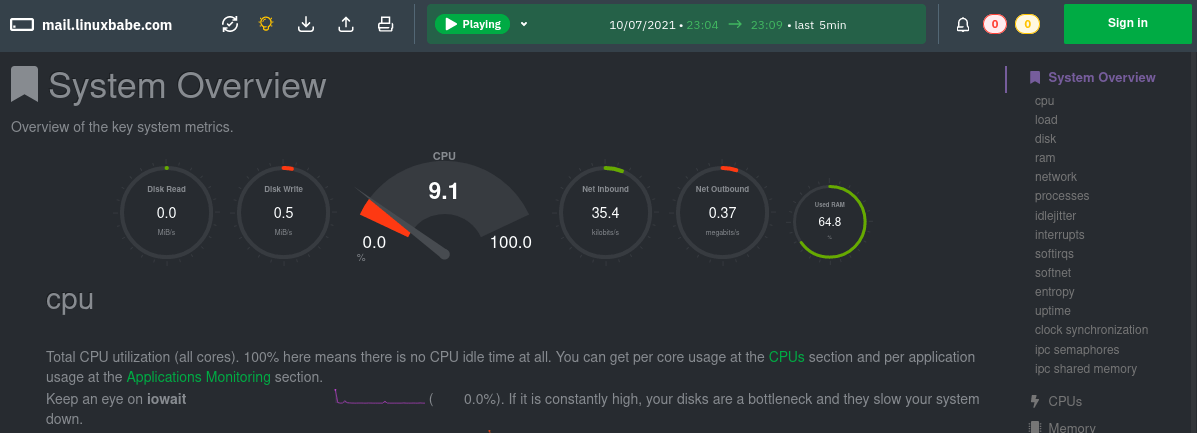
If your server has firewall enabled, then you need to open TCP port 19999. For instance, if you use the UFW firewall on Debian/Ubuntu, then run the following command.
sudo ufw allow 19999/tcp
If you use Firewalld on RHEL/CentOS/Alma Linux/Rocky Linux, then run the following commands.
sudo firewall-cmd --permanent --add-port=19999/tcp

sudo systemctl reload firewalld
Troubleshooting
If Netdata fails to install on your system, and you see the following error messages.
Makefile:3001: recipe for target 'all' failed
make: *** [all] Error 2
 FAILED

 FAILED

 ABORTED  netdata-installer.sh exited with error
Then you can try installing Netdata with the deb or RPM package.
Debian/Ubuntu
curl -s https://packagecloud.io/install/repositories/netdata/netdata/script.deb.sh | sudo bash

sudo apt install netdata
RHEL/CentOS/Alma Linux/Rocky Linux/Fedora
curl -s https://packagecloud.io/install/repositories/netdata/netdata/script.rpm.sh | sudo bash

sudo dnf install netdata
OpenSUSE
curl -s https://packagecloud.io/install/repositories/netdata/netdata/script.rpm.sh | sudo bash

sudo dnf install netdata
Step 2: Set Up Reverse Proxy
To access the web interface through domain name instead of IP address and port number, we can set up a reverse proxy for netdata with Nginx or Apache. This also allows us to enable HTTPS later.
Nginx
Install Nginx on the Linux server.
- Debian/Ubuntu:
sudo apt install nginx - Redhat/CentOS/Fedora:
sudo dnf install nginx - OpenSUSE:
sudo zypper install nginx - Arch Linux/Manjaro:
sudo pacman -S nginx
After Nginx is installed, create a virtual host config file for netdata under /etc/nginx/conf.d/ directory.
sudo nano /etc/nginx/conf.d/netdata.conf
Put the following text into the file. Replace the red-colored text with your actual domain name, and don’t forget to set DNS A record for this subdomain.
upstream backend {
   server 127.0.0.1:19999;
   keepalive 64;
}

server {
   listen 80;
   server_name netdata.example.com;

   location / {
     proxy_set_header X-Forwarded-Host $host;
     proxy_set_header X-Forwarded-Server $host;
     proxy_set_header X-Forwarded-For $proxy_add_x_forwarded_for;
     proxy_pass http://backend;
     proxy_http_version 1.1;
     proxy_pass_request_headers on;
     proxy_set_header Connection "keep-alive";
     proxy_store off;
   }
}
Save and close this file. Then test Nginx configuration.
sudo nginx -t
If the config test is successful, reload Nginx.
sudo systemctl reload nginx
Now the netdata web interface is available at http://netdata.example.com.
Apache
Install Apache on the Linux server.
- Debian/Ubuntu:
sudo apt install apache2 - Redhat/CentOS/Fedora:
sudo dnf install httpd - OpenSUSE:
sudo zypper install apache2 - Arch Linux/Manjaro:
sudo pacman -S apache
After Apache is installed, create a virtual host config file for netdata.
sudo nano /etc/apache2/sites-available/netdata.conf
or
sudo nano /etc/httpd/conf.d/netdata.conf
Put the following text into the file. Replace the red-colored text with your actual domain name, and don’t forget to set DNS A record for this subdomain.
<VirtualHost *:80>
    ProxyRequests Off
    ProxyPreserveHost On

    ServerName netdata.example.com

    <Proxy *>
        Require all granted
    </Proxy>

    ProxyPass "/" "http://localhost:19999/" connectiontimeout=5 timeout=30 keepalive=on
    ProxyPassReverse "/" "http://localhost:19999/"

    ErrorLog ${APACHE_LOG_DIR}/netdata-error.log
    CustomLog ${APACHE_LOG_DIR}/netdata-access.log combined
</VirtualHost>
Save and close the file. To use Apache as a reverse proxy, we need to enable the proxy modules and the header module.
sudo a2enmod proxy proxy_http rewrite headers proxy_wstunnel
Then enable this virtual host.
sudo a2ensite netdata.conf
Restart Apache
sudo systemctl restart apache2
Now you can access Netdata web interface using the domain name netdata.example.com.
Step 3: Listen on Localhost Only
By default, netdata listens on the public IP address. Now that netdata can be accessed via the Nginx reverse proxy, it’s a good security measure to make netdata listen only on 127.0.0.1 . Open the netdata config file.
sudo nano /etc/netdata/netdata.conf
If your system doesn’t have the /etc/netdata/netdata.conf file, then it’s located under then /opt/netdata/ directory.
sudo nano /opt/netdata/etc/netdata/netdata.conf
Go to the [web] section and find the following line (line 67).
# bind to = *
Remove the # sign and set its value to 127.0.0.1.
bind to = 127.0.0.1
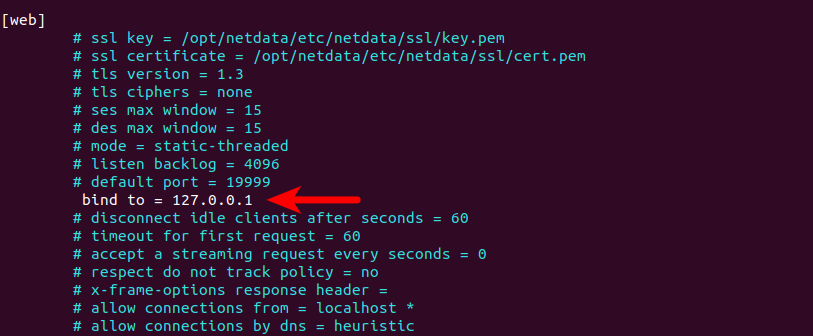
Save and close the file. Then restart netdata for the change to take effect.
sudo systemctl restart netdata
Please note that if you set the bind to value to the IPv6 address ::1. Then in Nginx virtual host config file, you should also specify an IPv6 address in the upstream section like below.
upstream backend {
   server [::1]:19999;
   keepalive 64;
}
Step 4: Enable HTTPS
It’s highly recommended that you use TLS to encrypt HTTP traffic. We can enable HTTPS by installing a free TLS certificate issued from Let’s Encrypt. Run the following command to install Let’s Encrypt client (certbot)
- Debian/Ubuntu:
sudo apt install certbot - RHEL/CentOS/Alma Linux/Rocky Linux:
sudo dnf install certbot - OpenSUSE:
sudo zypper install certbot - Arch Linux:
sudo pacman -S certbot
If you use Nginx, then you also need to install the Certbot Nginx plugin.
sudo apt install python3-certbot-nginx
Next, run the following command to obtain and install TLS certificate.
sudo certbot --nginx --agree-tos --redirect --hsts --staple-ocsp --email you@example.com -d netdata.example.com
If you use Apache, then you need to install the Certbot Apache plugin.
sudo apt install python3-certbot-apache
Next, run the following command to obtain and install TLS certificate.
sudo certbot --apache --agree-tos --redirect --hsts --staple-ocsp --email you@example.com -d netdata.example.com
Where
--nginx: Use the nginx plugin.--apache: Use the Apache plugin--agree-tos: Agree to terms of service.--redirect: Force HTTPS by 301 redirect.--hsts: Add the Strict-Transport-Security header to every HTTP response. Forcing browser to always use TLS for the domain. Defends against SSL/TLS Stripping.--staple-ocsp: Enables OCSP Stapling. A valid OCSP response is stapled to the certificate that the server offers during TLS.
The certificate should now be obtained and automatically installed.
Step 5: Enable Password Authentication
If you installed netdata on a production Linux server, it’s important to enable access control so only authorized users can see what applications are running on your system.
Nginx
Generate a password file with the following command. Replace the red-colored text with your preferred username and password. The password will be created at /etc/nginx/password.
printf "yourusername:$(openssl passwd -crypt 'yourpassword')" | sudo tee -a /etc/nginx/passwords
If you see the following warning message, don’t panic. Your password is fine.
Warning: truncating password to 8 characters
Then edit the Nginx virtual host config file for netdata.
sudo nano /etc/nginx/conf.d/netdata.conf
Add the auth directives in server section. auth_basic enables basic password authentication. auth_basic_user_file directive specifies the password file.
server {
.....

auth_basic "Protected";
auth_basic_user_file /etc/nginx/passwords;

....
Save and close the file. Then reload Nginx.
sudo systemctl reload nginx
Now your browser will ask you to enter the username and password.
Apache
Generate a password file with the following command. Replace the red-colored text with your preferred username and password. The password will be created at /etc/apache2/password.
printf "yourusername:$(openssl passwd -crypt 'yourpassword')" | sudo tee -a /etc/apache2/passwords
If you see the following warning message, don’t panic. Your password is fine.
Warning: truncating password to 8 characters
Then edit the Apache virtual host config file for netdata.
sudo nano /etc/apache2/sites-enabled/netdata-le-ssl.conf
Change the <Proxy *>...</Proxy> section to the following.
    <Proxy *>
        AllowOverride None
        AuthType Basic
        AuthName "Protected site"
        AuthUserFile /etc/apache2/passwords
        Require valid-user
    </Proxy>
Save and close the file. Then restart Apache.
sudo systemctl restart apache2
Now your browser will ask you to enter the username and password.
Netdata Linux Server Performance Monitoring Screenshot Tour
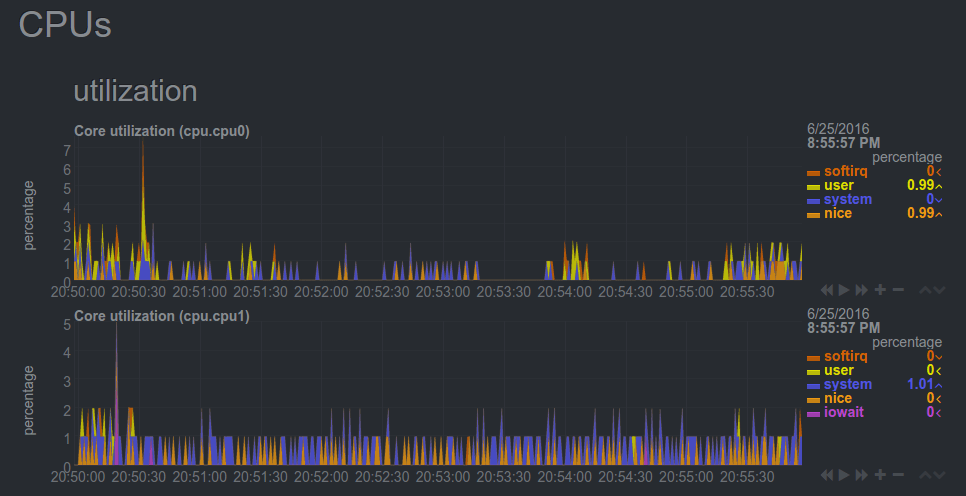
CPU Usage
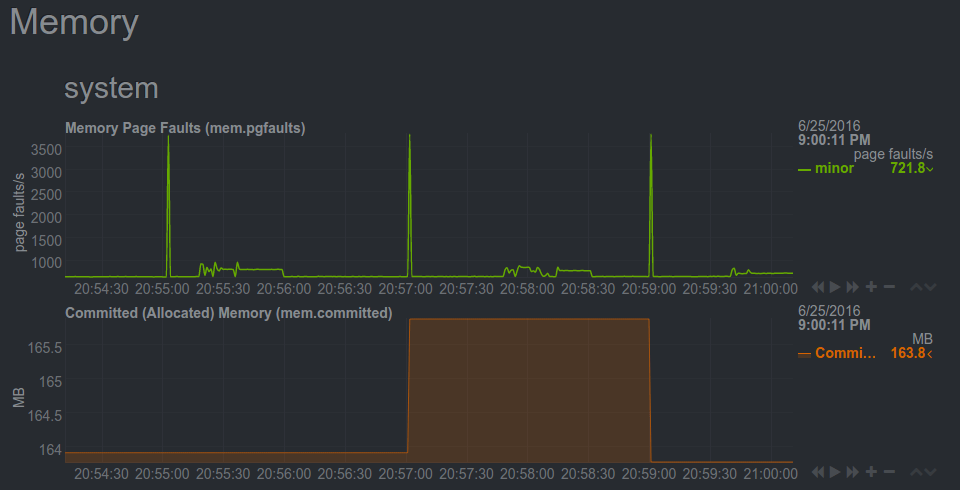
RAM Usage
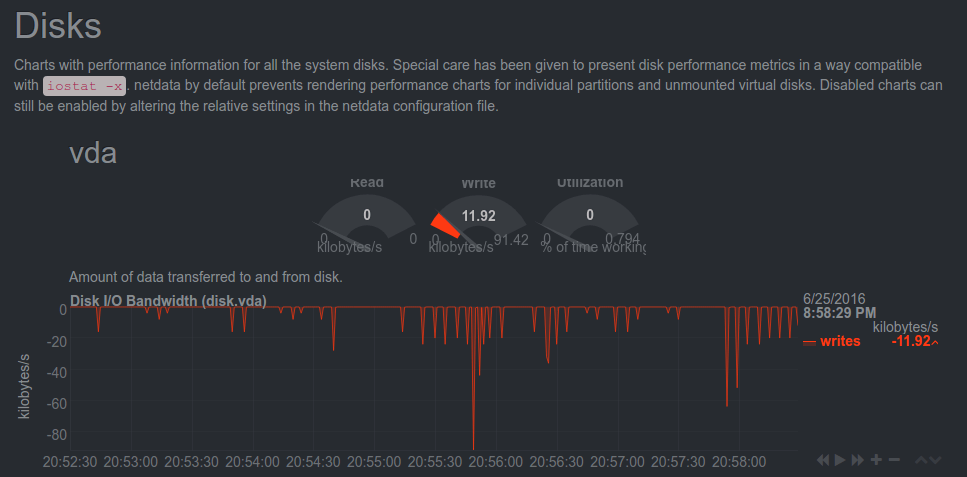
Disk I/O
Network Traffic
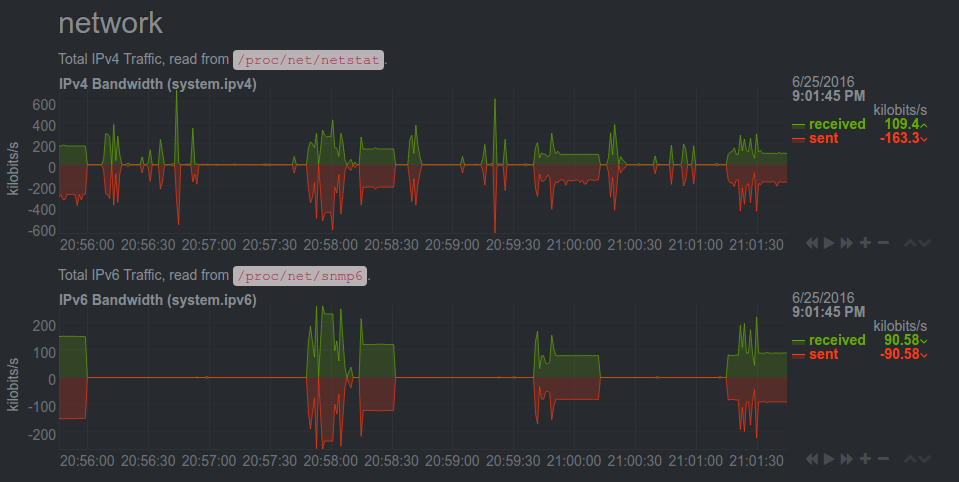
Memory De-duplication
If kernel memory de-duper (called Kernel Same-page Merging, or KSM) is available on your system, you can enable it to save 40-60% of netdata memory. To enable KSM, run the following command as root (sudo won’t work).
echo 1 >/sys/kernel/mm/ksm/run

echo 1000 >/sys/kernel/mm/ksm/sleep_millisecs
How to Enable Email Alert
Edi the health alarm notify config file with the following command.
sudo /etc/netdata/edit-config health_alarm_notify.conf
Find the following line.
DEFAULT_RECIPIENT_EMAIL="root"
By default, email alerts are sent to the root user on localhost. Change it to your email address.
DEFAULT_RECIPIENT_EMAIL="your-account@gmail.com"
Save and close the file. Then restart Netdata.
sudo systemctl restart netdata
If you use iRedMail, then email alerts are disabled and you will see the following line in this file.
SEND_EMAIL="NO"
Change it to
EMAIL_SENDER="netdata@yourdomain.com"

# enable/disable sending emails
SEND_EMAIL="YES"

# if a role recipient is not configured, an email will be send to:
DEFAULT_RECIPIENT_EMAIL="your-account@gmail.com"
Save and close the file. Then restart Netdata.
sudo systemctl restart netdata
You should install Postfix to send email alerts.
Debian/Ubuntu
sudo apt install postfix
RHEL/CentOS/Alma Linux/Rocky Linux
sudo dnf install postfix
OpenSUSE
sudo zypper install postfix
How to Uninstall Netdata
The uninstall script is available at /usr/libexec/netdata/netdata-uninstaller.sh.
How to Update Netdata
The update script is available at /usr/libexec/netdata/netdata-updater.sh. So when a new version comes out, run the following command.
sudo /usr/libexec/netdata/netdata-updater.sh
Fortunately, you don’t need to do it manually. A cron job (/etc/cron.daily/netdata-updater) is added by Netdata to automatically update the software daily.
How to Monitor Nginx Web Server Performance
In order to collect Nginx Performance metrics, you need to configure Nginx stub_status.
sudo nano /etc/nginx/conf.d/stub_status.conf
Add the following files to this file.
server {
     listen 127.0.0.1:80;
     server_name 127.0.0.1;
     location /nginx_status {
        stub_status on;
	allow 127.0.0.1;
	deny all;
     }
}
Save and close the file.Then reload Nginx for the changes to take effect.
sudo systemctl reload nginx
Now you can see the Nginx metrics in Netdata, which is accessible via the web log nginx menu on the right sidebar.
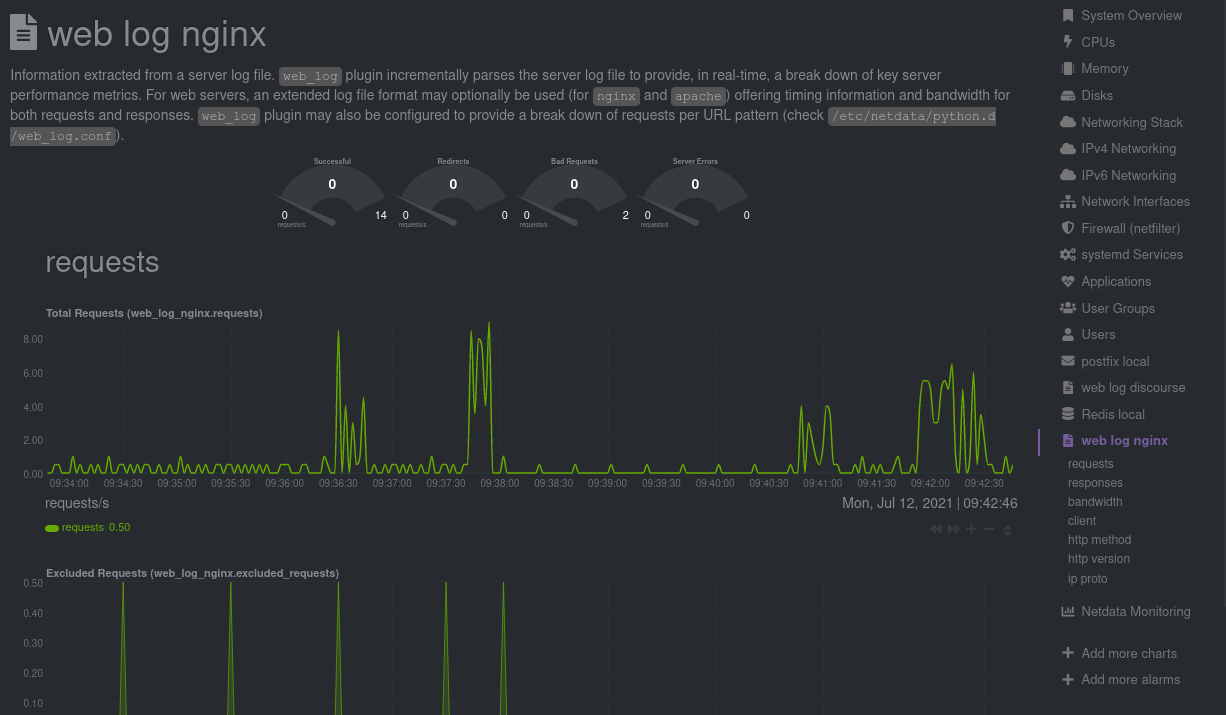
Netdata can collect information from Nginx log files. However, the default log format gives us limited information. If you really care about application performance, you should create a custom log format to show the request time, upstream response time, cache hits, etc.
Open the nginx.conf file.
sudo nano /etc/nginx/nginx.conf
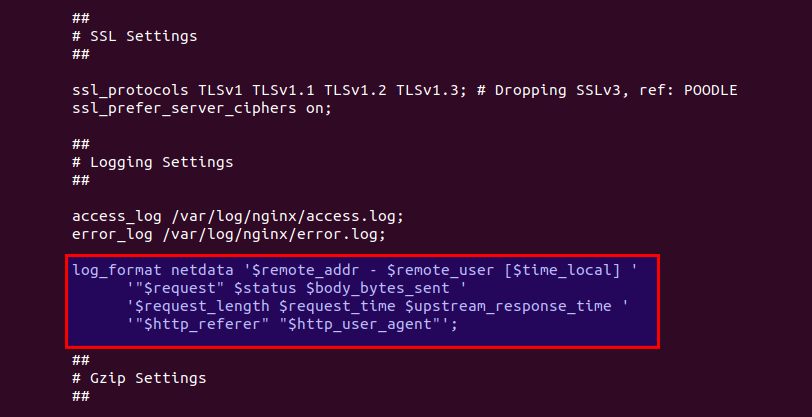
Go to the Logging Settings section in the http {...} context and add the following lines. Here we are creating a custom Nginx log format called netdata that includes information about request_time, and upstream_response_time, measured in seconds with millisecond resolution.
log_format netdata '$remote_addr - $remote_user [$time_local] '
              '"$request" $status $body_bytes_sent '
              '$request_length $request_time $upstream_response_time '
              '"$http_referer" "$http_user_agent"';
Save and close the file. Then open your Nginx virtual host configuration file. For example,
sudo nano /etc/nginx/conf.d/linuxbabe.com.conf
Your Nginx virtual host configuration file might be under /etc/nginx/sites-enabled/ directory. I like to use the /etc/nginx/conf.d/ directory.
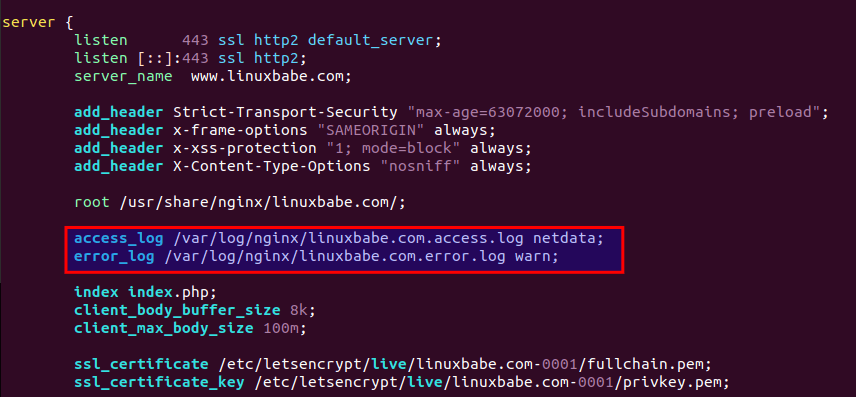
In the server {...} context, add the following two lines to enable access log and error log. The access log is using the netdata format and the error log uses the warn log level.
access_log /var/log/nginx/linuxbabe.com.access.log netdata;
error_log /var/log/nginx/linuxbabe.com.error.log warn;
Save and close the file. Then reload Nginx for the changes to take effect.
sudo systemctl reload nginx
Next, edit the Netdata web_log.conf file.
sudo /etc/netdata/edit-config python.d/web_log.conf
If your Netdata is installed under the /opt/netdata/ directory, then use the following command instead.
sudo /opt/netdata/etc/netdata/edit-config python.d/web_log.conf
Scroll down to the Nginx log section. Add the following lines.
yourdomain.com:
  name: 'yourdomain'
  path: '/var/log/nginx/yourdomain.com.access.log'
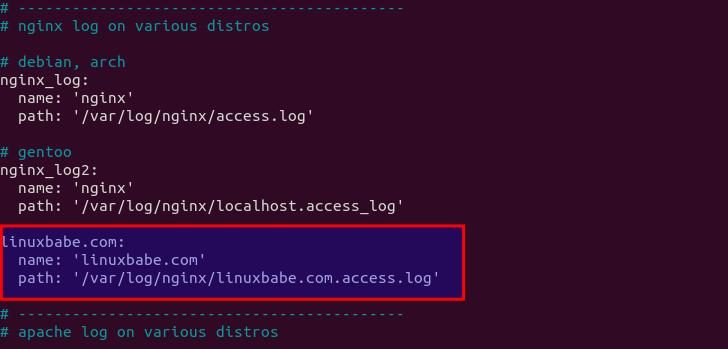
Save and close the file. Then grant read permission to the netdata user.
sudo setfacl -R -m u:netdata:rx /var/log/nginx/
Restart Netdata
sudo systemctl restart netdata
How to Monitor Apache Performance
First, run the following command to create the Netdata apache.conf file. You don’t have to edit anything in this file. Simply press Ctrl+X to exit.
sudo /etc/netdata/edit-config python.d/apache.conf
Next, edit the main Apache configuration file.
sudo nano /etc/apache2/apache2.conf
Find the LogFormat section and add two new log formats.
LogFormat "%h %l %u %t \"%r\" %>s %O %I %D \"%{Referer}i\" \"%{User-Agent}i\"" vhost_netdata
LogFormat "%h %l %u %t \"%r\" %>s %O %I %D \"%{Referer}i\" \"%{User-Agent}i\"" netdata
Save and close the file. Then edit your Apache virtual host file and use the following CustomLog setting.
CustomLog "/var/log/apache2/yourdomain.com.access.log" netdata
Save and close the file. Next, edit the Netdata web_log.conf file.
sudo /etc/netdata/edit-config python.d/web_log.conf
Scroll down to the Apache log section. Add the following lines.
yourdomain:
   name: 'yourdomain'
   path: '/var/log/apache2/yourdomain.com.access.log'
Save and close the file. Grant read permission to the netdata user.
sudo setfacl -R -m u:netdata:rx /var/log/apache2/
Then restart Apache and Netdata.
sudo systemctl restart apache2 netdata
If Netdata doesn’t show performance metrics for your Apache virtual host, check if the web_log.conf file has a typo or a syntax error.
Install Apache JMeter
Apache JMeter is an open-source load testing tool, available for Linux, macOS, and Windows. You can use it to test your website performance under various load scenarios.
Netdata Alternative
Netdata is a very powerful tool for performance monitoring, but it can be intimidating for newbies. A more newbie-friendly alternative is Nginx Amplify.
However, Nginx Amplify is slow to update for new Ubuntu releases (Ubuntu 22.04) and it can only monitor web applications based on the LEMP stack.
Wrapping Up
Hope you like this Linux server performance monitoring tool. Comments, questions or suggestions are always welcome. As always, if you found this post useful, subscribe to our free newsletter to get more tips and tricks 🙂


Great tutorial, thank you!
Thanks!
Thanks for the tutorial – lots of good info available in Netdata.
For each server do I need to install NetData or is there a client I can install to see everything feeding back into the primary?
Okay, found out after install that you can enable cloud monitoring. Very cool!!! Your content is always A++ !!!
you can go either with ND Cloud
or if self hosted can designate a server as Parent
and each node (child) sends its metrics to parent
Parent has a web UI on port 19999 , children dont have any UI (to lower resource usage)
look at Stream configuration settings in ND documentation
Hello, very nice tutorial as usual.
But i have a question, there is something that I wasn’t able to do. I have changed the lines between … into the file /etc/apache2/sites-enabled/netdata.conf but doesn’t ask me any password. Of course I have generated the file password with the username and the password
Thanks
Between the lines “…
I’m having the same issue with the password authentication. It is not asking me for a password.
Edit the Apache HTTPS virtual host file, not the HTTP virtual host file.
Hello, yes I did that last night. After that is asking me the password but even if I use the correct username and password it is telling that I use the wrong password so after that I generated the password using the command htpasswd and now it is working good
Thanks a lot for this !
Just a little add : if you want to access Netdata from a non-root directory (https://my.server/netdata/) you can add the following locations in your server block :
location /netdata { return 301 /netdata/; } location ~ /netdata/(?<ndpath>.*) { proxy_redirect off; proxy_set_header Host $host; proxy_set_header X-Forwarded-Host $host; proxy_set_header X-Forwarded-Server $host; proxy_set_header X-Forwarded-For $proxy_add_x_forwarded_for; proxy_http_version 1.1; proxy_pass_request_headers on; proxy_set_header Connection "keep-alive"; proxy_store off; proxy_pass http://backend/$ndpath$is_args$args; gzip on; gzip_proxied any; gzip_types *; }it seams that my code was truncated when I post it :
you must read : location ~/netdata/(?<ndpath>.*) {
Updated your code.
I’ve installed this on an old Dell T610 running OpenMediaVault, with no conflicts with the OMV Dashboard, it works perfectly. The online real time monitoring is well done too.
Your tutorial was easy to follow, thank you.
Thank you for all the information.
….and all data is going to…the company.
I say no.
Simply disable telemetry with:
Wow. Thank you. Confirm.
Hello, thank you for this nice and very useful tutorial!
Everything work fine as expected. But I have a problem: every night (midnight) the
and
stop at 01:00 a.m. and I receive mail alerts from netdata (python.d_job_last_collected_secs and go.d_job_last_collected_secs). The charts for this 2 also stopped at this time.
After restarting apache2 and netdata the charts for the server and v_hosts doesn’t appear. All the other charts work without problems. When I execute
and restart apache2 and netdata, all the charts appear again and everything work fine until midnight.
Any advise or idea? I’m using ubuntu 20.04 server ona Raspberry Pi 4.
Thanks and regards,
Rafael
After a bit of investigation I found out that at midnight the apache logs cycle (new file) and the user netdata has no permission on the new file. It seems that the setfacl only apply to existing files in the folder. Is there any option to grant permission to new files also?
Thanks
Create a cron job
Add the following line in the crontab file.
Save and close this file. So this command will run at 12:00 AM midnight.
Thank you for your reply. I will test this. Meanwhile I came out with the following solution: I performed this
I added the d to -R to make it default and it worked. I hope this is no security issue… all seems to work.
Thanks and regards
Hm, I have the Mailserver with iRedAdmin installed and up and running, however I cant access the netdata interface via “https://my.server.com/netdata”
I have a netdata directory in /opt/ but nginx ist showing “502 Bad Gateway” with the above link….
Any advice is greatly appreciated.
Thank you LinuxBabe!!!
-Add Fail2ban-
sudo setfacl -R -m u:netdata:rx /var/log/fail2ban.log
sudo systemctl restart netdata
Hello, I’m trying to open web_log.conf with your suggested command
sudo /etc/netdata/edit-config python.d/web_log.conf
but I’m getting this message of file not found:
File ‘python.d/web_log.conf’ is not found in ‘/usr/lib/netdata/conf.d’
Let me know waht to do.
Thank you
Need Update Config is clear …
After installation, I run the command
and it returns the following warning:
Does this mean Netdata is misconfigured and what can I do to fix it?