Set Up ParseDMARC on Ubuntu 18.04, 16.04 to Analyze DMARC Reports
ParseDMARC is an open-source, self-hosted DMARC report analyzer. For those who don’t know, DMARC is an email security standard that can protect your domain name from email spoofing and also identify incoming spoofed emails to protect end users. In a previous article, we discussed how to create DMARC DNS record for your domain name and in this tutorial, we are going to set up ParseDMARC on Ubuntu 18.04/16.04 server so we can analyze DMARC reports.
Prerequisites
It is assumed that you have created a DMARC DNS record for your domain name.
To generate visualized data, ParseDMARC relies on Elasticsearch and Kibana, both of which are RAM hungry. They will use about 2G RAM after installation and require more RAM to process data. So you need a server with at least 3G RAM. You can click this special link to get $100 free credit on DigitalOcean. (For new users only). If you are already a DigitalOcean user, then you can click this special link to get $50 free credit on Vultr (for new users only). Once you have an account at DigitalOcean or Vultr, install Ubuntu 18.04 or 16.04 on your server and follow the instructions below.
Installing ParseDMARC on Ubuntu 18.04 or Ubuntu 16.04
ParseDMARC is a Python program and can be installed from the PyPI (Python Package Index) software repository. First, we need to install the Python package installer on Ubuntu 18.04/16.04. In the following command, we install the python3-pip package because ParseDMARC can only work with Python 3. The geoipupdate package is used to update the MaxMind GeoIP database.
sudo apt install python3-pip geoipupdate
Then install the latest stable version of ParseDMARC with the following command.
sudo -H pip3 install -U parsedmarc
To check information about the parsedmarc package, you can run
pip3 show -f parsedmarc
To see command line options, run
parsedmarc --help
Installing Elasticsearch and Kibana on Ubuntu 18.04/16.04
ParseDMARC is a command-line program, which produces hard-to-read output. If you want to see visualized DMARC reports in a web-based interface, you need to install two other open-source programs: Elasticsearch and Kibana. Elasticsearch is a search and analytics engine and Kibana allows users to visualize data with charts and graphs in Elasicsearch.
We can install Elasticsearch and Kibana from the official repository with the following commands. Elasticsearch is written in Java programming language, so we also install the default-jre-headless (Java runtime environment) package in the last command.
sudo apt-get install -y apt-transport-https

wget -qO - https://artifacts.elastic.co/GPG-KEY-elasticsearch | sudo apt-key add -

echo "deb https://artifacts.elastic.co/packages/7.x/apt stable main" | sudo tee -a /etc/apt/sources.list.d/elastic-7.x.list

sudo apt-get update

sudo apt-get install -y default-jre-headless elasticsearch kibana
By default, the Elasticsearch systemd service is disabled. You can start and enable it with the following commands.
sudo systemctl start elasticsearch

sudo systemctl enable elasticsearch
Then check the status.
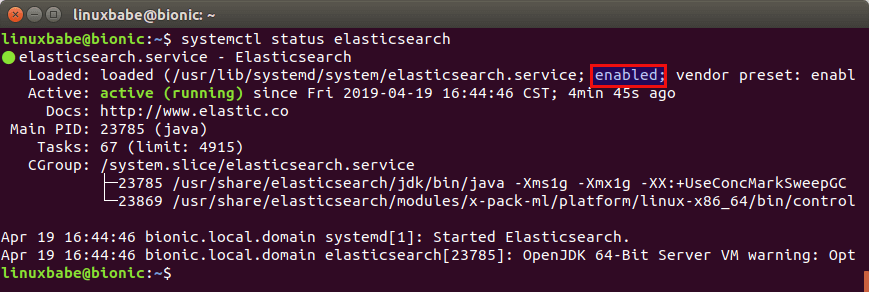
systemctl status elasticsearch
We can see that it’s now enabled and running. (Hint: if this command doesn’t quit immediately, press Q to quit.)
We also need to do the same for Kibaba.
sudo systemctl start kibana

sudo systemctl enable kibana
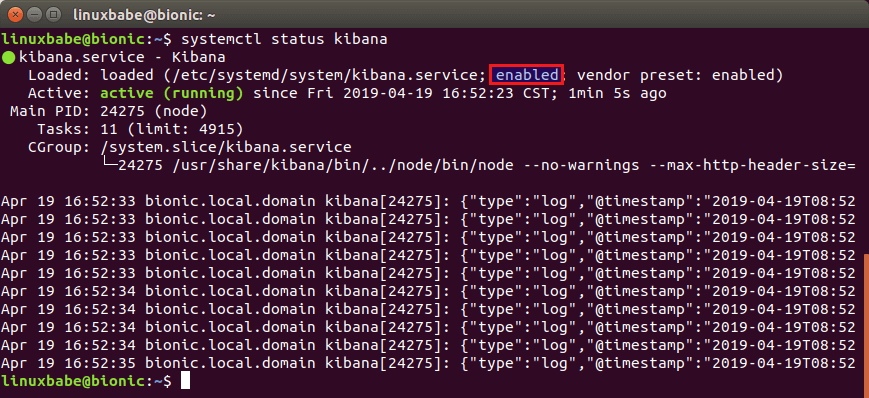
Check the status.
systemctl status kibana
Setting Up Nginx Reverse Proxy for Kibana
Kibana web server listens on 127.0.0.1:5601. We can use Nginx to set up reverse proxy to allow for remote access and also protect Kibana web interface. Run the following command to install Nginx from Ubuntu 18.04, 16.04 repository.
sudo apt install nginx
Create a Nginx virtual host file for Kibana.
sudo nano /etc/nginx/conf.d/kibana.conf
Put the following lines into the file. Replace the placeholder as necessary and you should create a DNS A record for the sub-domain.
server {
      listen 80;
      server_name dmarc.yourdomain.com;

      access_log /var/log/nginx/dmarc.access;
      error_log /var/log/nginx/dmarc.error;

      add_header X-Frame-Options SAMEORIGIN;
      add_header X-Content-Type-Options nosniff;

      location / {
         proxy_pass http://127.0.0.1:5601;
         proxy_set_header Host $host;
         proxy_set_header X-Real-IP $remote_addr;
         proxy_set_header X-Forwarded-For $proxy_add_x_forwarded_for;
      }
}
Save and close the file. Then test Nginx configurations.
sudo nginx -t
If the test is successful, reload Nginx for the change to take effect.
sudo systemctl reload nginx
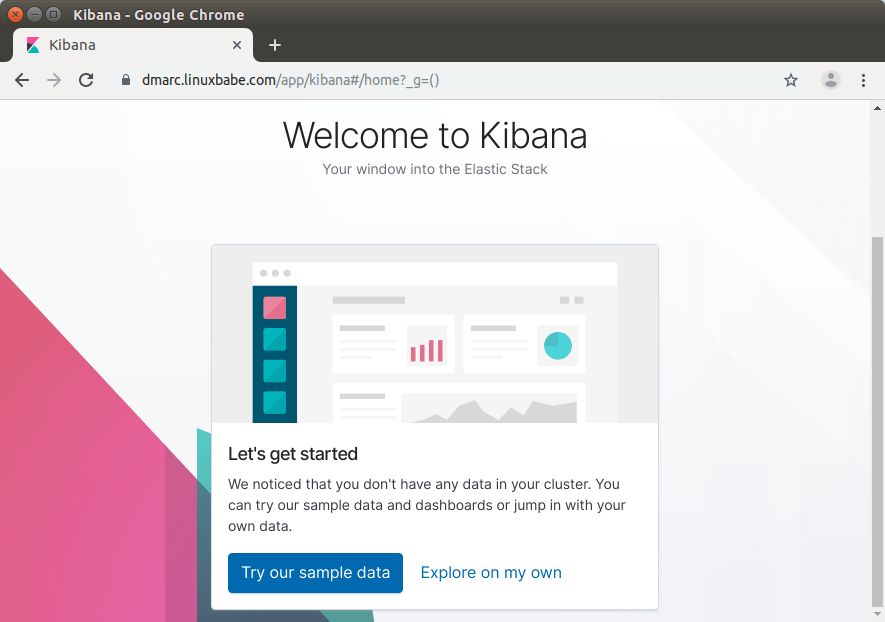
Now you can access Kibana dashboard at dmarc.yourdomain.com. Click the Explore on my own button.
Enable HTTPS
To encrypt the HTTP traffic when you visit Kibana dashboard via a domain name, we can enable HTTPS by installing a free TLS certificate issued from Let’s Encrypt. Run the following command to install Let’s Encrypt client (certbot) on Ubuntu 18.04, 16.04 server.
sudo apt install certbot
If you use Nginx, then you also need to install the Certbot Nginx plugin.
sudo apt install python3-certbot-nginx
Next, run the following command to obtain and install TLS certificate.
sudo certbot --nginx --agree-tos --redirect --hsts --staple-ocsp --email you@example.com -d dmarc.yourdomain.com
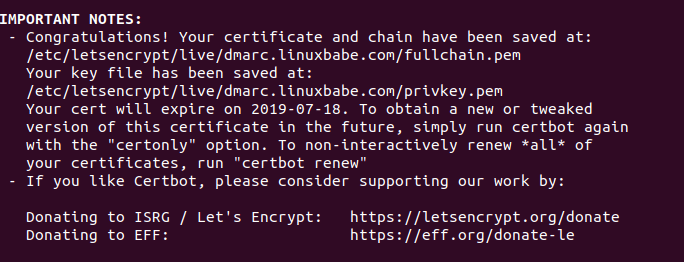
The certificate should now be obtained and automatically installed.
Restricting Access to the Kibana Dashboard
By default, Kibana doesn’t provide user authentication. To allow only trusted users to access Kibana dashboard, we can enable HTTP basic authentication in Nginx. First, we need to install the apache2-utils package which provides the htpasswd password file create tool.
sudo apt install apache2-utils
Then run the following command to create the admin user. You will need to set a password.
sudo htpasswd -c /etc/nginx/htpasswd admin
Next, edit the Kibana virtual host file.
sudo nano /etc/nginx/conf.d/kibana.conf
Add the following two lines in the listen 443 ssl server block.
auth_basic "Login required";
auth_basic_user_file /etc/nginx/htpasswd;
Save and close the file. Then test Nginx configurations.
sudo nginx -t
If the test is successful, reload Nginx for the change to take effect.
sudo systemctl reload nginx
Now you reload the Kibana dashboard in your web browser, you will be asked to enter an username and password.

Configuring ParseDMARC
In order to use ParseDMARC and send data to Elastisearch, we need to create a configuration file.
sudo nano /etc/parsedmarc.ini
Put the following lines in the file. Replace the palceholders as necessary.
[general]
# Save aggregate and forensic reports to Elasticsearch
save_aggregate = True
save_forensic = True

[imap]
# Log into the DMARC report email address and download data.
host = mail.yourdomain.com
port = 993
ssl = True
user = dmarc@yourdomain.com
password = your_password_here
watch = True

[elasticsearch]
# Send data to Elastichsearch, which listens on port 9200.
hosts = 127.0.0.1:9200
ssl = False

[smtp]
# For sending email
host = mail.yourdomain.com
port = 587
ssl = True
user = dmarc@yourdomain.com
password = your_password_here
from = dmarc@yourdomain.com

# send results to this address
to = admin@yourdomain.com
Save and close the file.
Running ParseDMARC as a Systemd Service
We can manually run ParseDMARC with parsedmarc -c /etc/parsedmarc.ini (Don’t run this command just yet), but it’s more convenient to run ParseDMARC as a systemd service in the background. Create a systemd service unit file for ParseDMARC with the following command.
sudo nano /etc/systemd/system/parsedmarc.service
Put the following lines into the file.
[Unit]
Description=parsedmarc mailbox watcher
Documentation=https://domainaware.github.io/parsedmarc/
Wants=network-online.target
After=network.target network-online.target elasticsearch.service

[Service]
ExecStart=/usr/local/bin/parsedmarc -c /etc/parsedmarc.ini
User=parsedmarc
Group=parsedmarc
Restart=always
RestartSec=5m

[Install]
WantedBy=multi-user.target
Save and close the file. This systemd service will run as the parsedmarc user, so we need to create the user with the following command.
sudo adduser --system --no-create-home --group parsedmarc
We also need to protect the /etc/parsedmarc.ini file so only root and parsedmarc group users can read it.
sudo chown parsedmarc /etc/parsedmarc.ini

sudo chmod 600 /etc/parsedmarc.ini
ParseDMARC will need to download MaxMind GeoIP database to /usr/share/elasticsearch/modules/ingest-geoip directory, so the parsedmarc user needs to have write permission.
sudo setfacl -R -m "u:parsedmarc:rwx" /usr/share/elasticsearch/modules/ingest-geoip/
Now we can start and enable the parsedmarc systemd service.
sudo systemctl start parsedmarc

sudo systemctl enable parsedmarc
Check status.
systemctl status parsedmarc

ParseDMARC will start fetching DMARC reports from the report email address and send them to Elasticsearch for analysis. If you have lots of DMARC report emails, please be patient to let ParseDMARC finish its work.
If the parsedmarc service isn’t active (running), you can run the following command to see what’s wrong.
sudo journalctl -eu parsedmarc
Importing ParseDMARC Objects In Kibana
To use the Kibana dashboard with ParseDMARC, first you need to import the ParseDMARC objects. You can use the following command to download it on your local Linux or Mac computer.
wget https://raw.githubusercontent.com/domainaware/parsedmarc/master/kibana/export.ndjson
If you use Windows, just copy the https link and paste it in browser address bar to download the data.
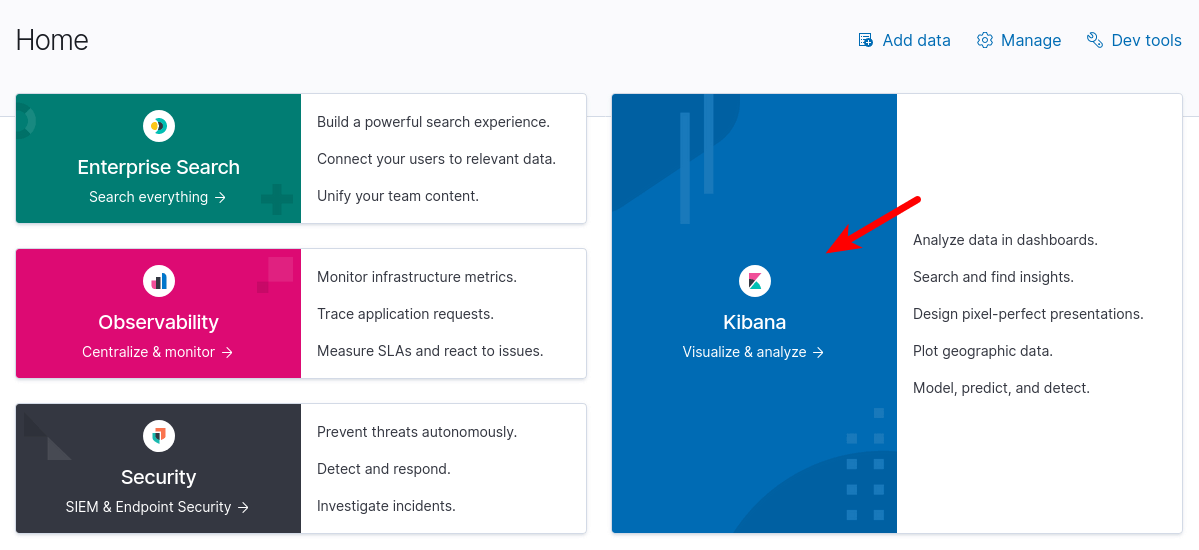
Then in Elastic Home page, click Kibana to access the Kibana dashboard.
Then in Kibana dashboard, click Add your data button.

Next, select Saved Objects and click the Import button to import the ParseDMARC objects you downloaded. 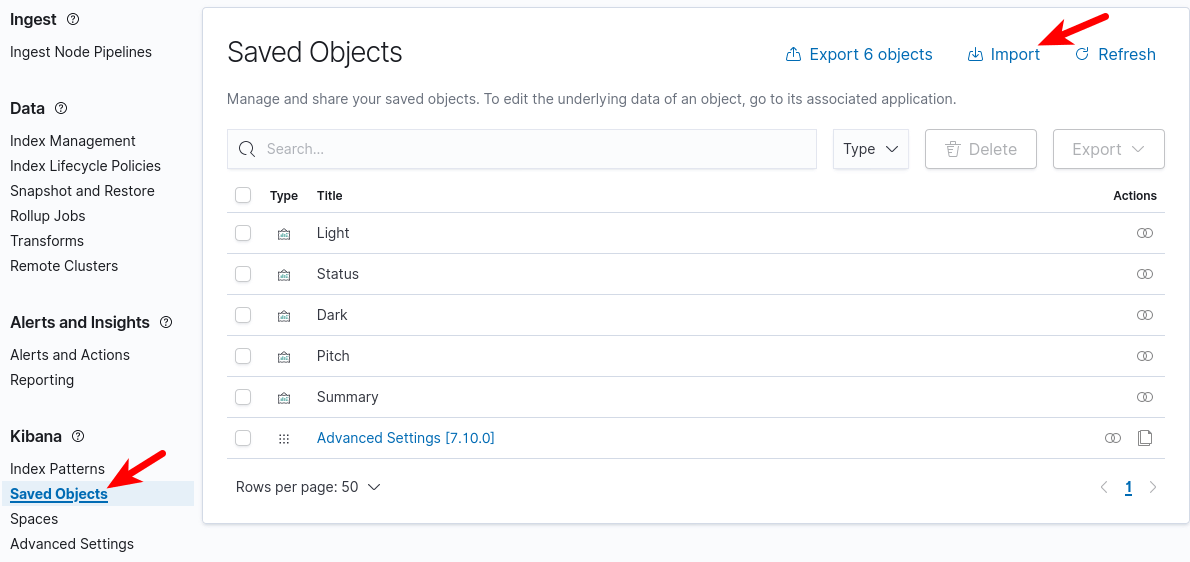
Analyzing DMARC Reports in Kibana
Once the ParseDMARC systemd service finishes reading emails, the DMARC report data will show up in Kibana. The most useful report I think is the DMARC Summary. You can check it by going to Saved Objects -> DMARC Summary and then click the view Dashboard button. The most useful thing you can do with DMARC summary is to identify legitimate sources that failed DMARC check.
- Filter the results to only show messages that didn’t pass DMARC.
- Then you can see the message dispositions (How the receiving email servers handle them: do nothing, put into spam folder, or reject them).
- Scroll down to see the SPF alignment and DKIM alignment details to identify the reason why some legitimate sources failed DMARC check.
If the sender doesn’t include DKIM signature or doesn’t have a reverse DNS record, then it’s clearly spam.
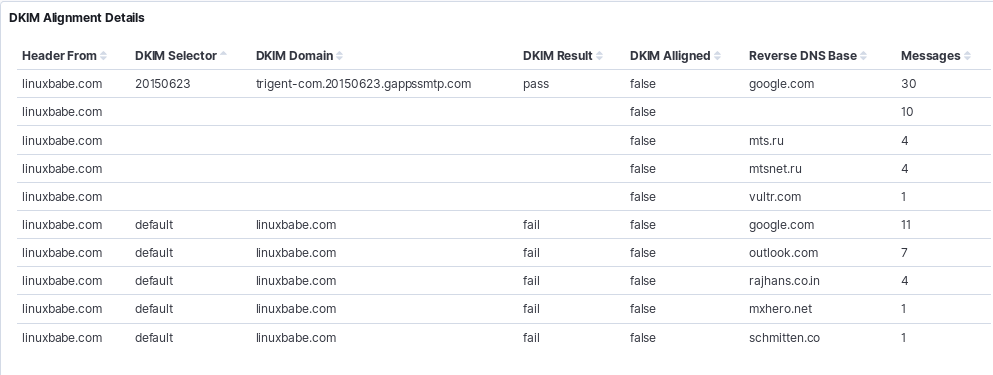
What surprises me is that some mailbox providers uses their own domain name in the DKIM signature when forwarding my legitimate emails. Other mailbox providers uses my domain name in the DKIM signature but still failed DKIM alignment. To further investigate the cause, you can check the individual forensic report.
Conclusion
I hope this tutorial helped you set up ParseDMARC on Ubuntu 18.04 and Ubuntu 16.04 to analyze DMARC reports. As always, if you found this post useful, then subscribe to our free newsletter to get more tips and tricks. Take care 🙂


Hi,
thanx for your very good How tos.
Is there a chance to use ParseDMARC on a multi-domain-mailserver?
Thanx
Matthias
You can create multiple ParseDMARC configuration files like:
Each file using a different IMAP account to download DMARC report from different domains. Then create systemd service unit for each configuration file.
When setting up different configurations, how to point those to different dashboards?
An alternative to this would be to setup a fw for each inbox that receives DMARC reports (assuming you have a specific inbox JUST for DMARC reports) per domain to one other inbox, for example:
dmarc@domain1.com
dmarc@domain2.net
dmarc@domain3.ie
all fw mails automatically to
dmarc@domain4.co.uk
which is the inbox you would have setup for this parsedmarc.
Thanks for helping people deploy ParseDMARC. Let me know if you have any feature requests 🙂
Sean Whalen
Author of ParseDMARC
Dear Sean, I have Parsedmarc 6.7.4.
Is it possible to use the “skip_certificate_verification” IMAP option in order to ignore the SSL certificate verification ?
Because I put this option = True but I still get this error:
Thanks.
Hi,
I followed your setup, however when I run parsedmarc as a service I didn’t get updates in Kibana. All reports were classified as ‘Invalid’.
I found out I get errors :
…yahoo.fr Report-ID: ” is not a valid aggregate DMARC report: Unexpected error: Error downloading https://geolite.maxmind.com/download/geoip/database/GeoLite2-Country.tar.gz: [Errno
13] Permission denied: ‘GeoLite2-Country_20191008’. I checked the rights for /usr/share/elasticsearch/modules/ingest-geoip/ and that seems OK.
Running parsedmarc manually, as root, handles the reports fine.
I tried do read the sources, but I can’t find where that download happens.
Any suggestions ?
TIA
Running on Ubuntu 16.04, parsedmarc 6.6.1
Koenraad
Hi @Koenraad,
I’m having the same issue:
Oct 25 10:22:43 dmarc parsedmarc[2233]: WARNING:__init__.py:1076:Message with subject “Testing 1” is not a valid aggregate DMARC report: Unexpected error: Error downloading https://geolite.maxmind.com/download/geoip/database/GeoLite2-Country.tar.gz: [Errno 13] Permission denied: ‘GeoLite2-Country_20191022’
@Xiao Guoan, Please HELP!
I went through this link and ran the geoipupdate command and it worked!
https://github.com/domainaware/parsedmarc/issues/108
Thanks for this nice article, I am planning to create seprate panel for each domain administrator so that all subadmin can check report of their domains only. But superuser has only access to report of all domains.
Can you please guide me on this.
The only trouble I had is with the parsedmarc.ini where I’m using Google G Suite account. Had to enable IMAP and create an APP password. When I tried using the user@domainname.com/password combination, I get this ERROR:cli.py:606:IMAP Error: [AUTHENTICATIONFAILED] Invalid credentials (Failure).
When I run “parsedmarc -c /etc/parsedmarc.ini”, I get an IMAP certificate error:
ERROR:cli.py:606:IMAP Error: [SSL: CERTIFICATE_VERIFY_FAILED] certificate verify failed: unable to get local issuer certificate (_ssl.c:1056)
My parsedmarc.ini file is filled as you suggested.
Please can you help me? Is it possible to ignore the SSL certificate validation ?
Thanks.
There’s no such option to disable SSL certificate validation according to
parsedmarc --help. It’s better to install a valid SSL certificate on your mail server. There’s free Let’s Encrypt SSL certificate.I have a autogenerated SSL certificate, and at this moment it’s impossible to use a public one.
So you think is it impossible to me to use parsedmarc in my current scenario ?
Thanks a lot again.
You can change the DMARC record to make DMARC reports go to a different mailbox. You don’t have to use an email address on your own domain.
I’ve followed yur tutorial step-by-step and when I run:
# parsedmarc -c /etc/parsedamrc.ini
I get this error for each DMARC processed message:
ERROR:utils.py:331:Error downloading https://geolite.maxmind.com/download/geoip/database/GeoLite2-Country.tar.gz: HTTPSConnectionPool(host='geolite.maxmind.com', port=443): Max retries exceeded with url: /download/geoip/database/GeoLite2-Country.tar.gz (Caused by NewConnectionError(': Failed to establish a new connection: [Errno -2] Name or service not known'))When I went to the URL https://geolite.maxmind.com/download/geoip/database/GeoLite2-Country.tar.gz, I realized that it doesn’t exist anymore.
I have install geoip-database and geoip-database-extra packages in my Ubuntu box.
Can you help please ?
Thanks in advance.
Don’t run it manually. Use the systemd service to run it.
After implementation of Parsedmarc/Elasticsearch/Kibana, I can’t see on Kibana dashboard the Reverse DNS fields, they are empty. I don’t know if it’s a parsedmarc problem or maybe some other issue.
In my Debian box I have setup my own public DNS’s, and not DNS’s from Internet. My own public DNS’s can make reverse resolution as I could verify.
How can I check where reverse DNS is done and why does it fails???
Thanks a lot !!!
Thanks a lot.
Thank you so much for this walk-through. I have it setup under WSL2 – which took some extra care. Everything ran smoothly and I have around 500 messages for it to parse as a starting point.
Thanks
I’ve followed your detailed guide but when I run the
“wget https://raw.githubusercontent.com/domainaware/parsedmarc/master/kibana/kibana_saved_objects.json”
I receive ERROR 404: Not found on Ubuntu terminal.
Please can you help?
The URL changed. Use
curl https://raw.githubusercontent.com/domainaware/parsedmarc/master/kibana/kibana_saved_objects.json
The new URL is here: https://raw.githubusercontent.com/domainaware/parsedmarc/master/kibana/export.ndjson
Hi
Ive everything going now, but only a small part of my data is showing. Ive got data showing from 10-26 Oct showing, but although Ive got mails from then to 4 December, its not showing. Is the a wat to manually upload / insert the data?
To successfully install parsedmarc on Debian 10 I had to additionally install some required packages:
Hi,
I’m using Elastic 7.12.0 and the import of the dmarc_forensic* index doesn’t work.
Could you please help me?
Hello
Thank you so much for the great tutorial I have set it up on the ec2 vm and I can see the email coming in now from imap google account.
But on the main dashboard in small window it saying ‘Your data is not secure Don’t lose one bit. Enable our free security features.’
It take me to the ‘Set up minimal security for Elasticsearch’ page with the instruction to setup the minimal security. But do I need it? I think this is needing if run on different server but because everything run on the same box so do I have to do it?
Or is it a big security problem?
I having the same problem. I setup new account on the Maxmind with GeoIP license and download config but I still getting problem dmarc_forensic* error.
Did you fixing it yet?
I understand from the configuration ini file that parsedmarc processes the aggregate and forsenic reports in one email address. if my org has chosen to use two email addresses: rua@exmaple.com and ruf@exmaple.com, any idea to go around this problem?
Getting this after installation –
No matching indices found: No indices match pattern “dmarc_aggregate*”
I am getting this error as well and can’t find an answer anywhere. Were you able to resolve it?
Same here, any advices ?
Could anyone solve this issue?
Same error here, any hint?
Hi, thanks for the great tutorial! Everything appears to be working at the aggregate level (reporting), but for me, both the DKIM and SPF Details are producing an error. Has anyone seen this error? (Attaching screen shot)
Thanks for your article. I ran the commands as you stated above but had a question about the parsedmarc.ini file.
1) I want to use graph to retrieve the gz files. Do you have a sample of the configuration if you want to use graph?
mine is set as follows
[general]
# Save aggregate and forensic reports to Elasticsearch
save_aggregate = True
save_forensic = False
[elasticsearch]
# Send data to Elastichsearch, which listens on port 9200.
hosts = 127.0.0.1:9200
ssl = False
[msgraph]
auth_method = ClientSecret
client_id = CLIENT
client_secret = SECRET
tenant_id = TENANTID
mailbox = dmarcreports@blankrome.com
2) When I run “sudo journalctl -eu parsedmarc”, I see this error: ERROR:cli.py:969:Mailbox Error: folder INBOX not found.
I know the inbox exists. I have a couple thousand emails in there I would like to start analyzing.
I also get this: No matching indices found: No indices match pattern “dmarc_aggregate*”
I am guessing it is because nothing has been ingested to analyze. Is this the case?
i also have this error
do you mange to solve it ?
Great content, I have found an open source PHP based DMARC system which can be used on shared hosting without needing the power hog of elastic search. https://github.com/liuch/dmarc-srg (Not affiliated just a happy end user)
Hi There,
I am trying to get our parsedmarc working, but I cant get the service to start. When I run “service parsedmarc status” I get,
Redirecting to /bin/systemctl status parsedmarc.service
● parsedmarc.service – parsedmarc mailbox watcher
Loaded: loaded (/etc/systemd/system/parsedmarc.service; enabled; vendor preset: disabled)
Active: activating (auto-restart) (Result: exit-code) since Tue 2024-04-02 20:44:38 UTC; 20s ago
Docs: https://domainaware.github.io/parsedmarc/
Process: 31643 ExecStart=/usr/local/bin/parsedmarc -c /etc/parsedmarc.ini (code=exited, status=1/FAILURE)
Process: 31616 ExecStartPre=/bin/sleep 30 (code=exited, status=0/SUCCESS)
Main PID: 31643 (code=exited, status=1/FAILURE)
When I run “journalctl -u parsedmarc.service -r” I see
: parsedmarc.service failed.
Unit parsedmarc.service entered failed state.
parsedmarc.service: main process exited, code=exited, status=1/FAILURE
ERROR:cli.py:774:You must supply input files or a mailbox connection
Started parsedmarc mailbox watcher.
Starting parsedmarc mailbox watcher…
Stopped parsedmarc mailbox watcher.
parsedmarc.service failed.
Unit parsedmarc.service entered failed state.
What input files or mailbox is required. I have set the flag “reports_folder = INBOX” but I am not sure what else I can set.
We are using the IMAP but I am not sure if this is the erorr.