How to Use Apache JMeter to Load Test Web Applications
Apache JMeter is an open-source load testing tool, available for Linux, macOS, and Windows. In a previous tutorial, we explained how to use Netdata to monitor the performance of Apache/Nginx web servers. Apache JMeter is a great complementary tool for testing your website performance under various load scenarios.
JMeter Features
- Simple and intuitive GUI.
- It can conduct performance test, load test and stress test for many server types – HTTP, HTTPS, SOAP, database, LDAP, SMTP, IMAP, POP3, etc.
- Test plans are stored in XML format, which means you can generate a test plan using a text editor.
- Full multi-threading
- Highly extensible
- Automated test and functional test.
- Validate server response with assertions.
- View test results in tables and graphs
Install Apache Jmeter on Desktop Linux
Apache JMeter is 100% pure Java application, so we need to install Java runtime in order to use it.
Debian/Ubuntu
sudo apt install default-jre-headless default-jdk-headless
CentOS/Alma Linux/Rocky Linux/Fedora
sudo dnf install java-11-openjdk
OpenSUSE
sudo zypper install java-11-openjdk
To check your Java version, run
java -version

Note that Java 16 isn’t compatible with Apache JMeter right now.
Windows and macOS
Windows and macOS users can download JDK 11 from the Oracle website.
Although JMeter may be included in your Linux distribution’s software repository, for better test results, it’s recommended to download the latest stable version from the official Jmeter website.
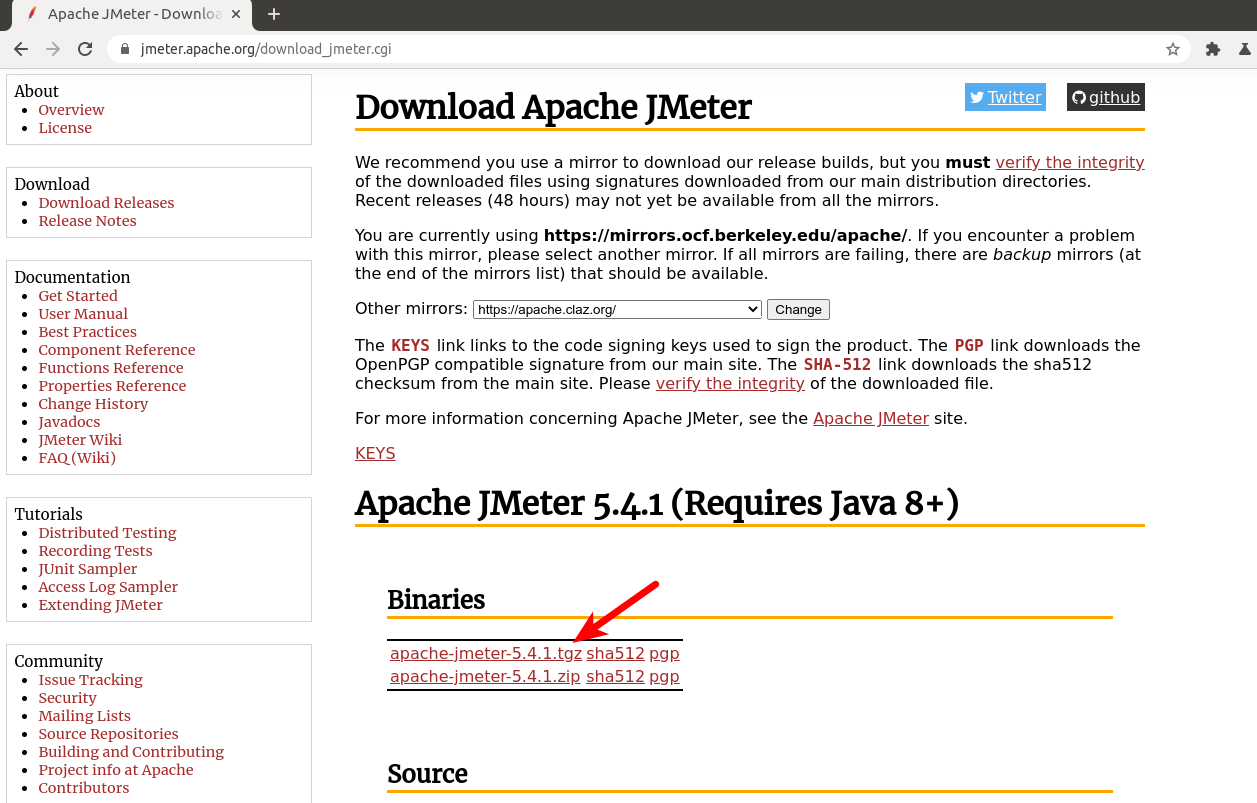
Download the .tgz file. Then open a terminal window and go to the Download destination folder. For example, I downloaded the file to ~/Downloads/ directory.
cd ~/Downloads/
Then extract the archive.
tar xvf apache-jmeter-5.4.1.tgz
Move the JMeter directory to /opt/, which is for third-party applications.
sudo mv apache-jmeter-5.4.1 /opt/apache-jmeter
Now you can start Apache JMeter with the following command.
/opt/apache-jmeter/bin/jmeter.sh
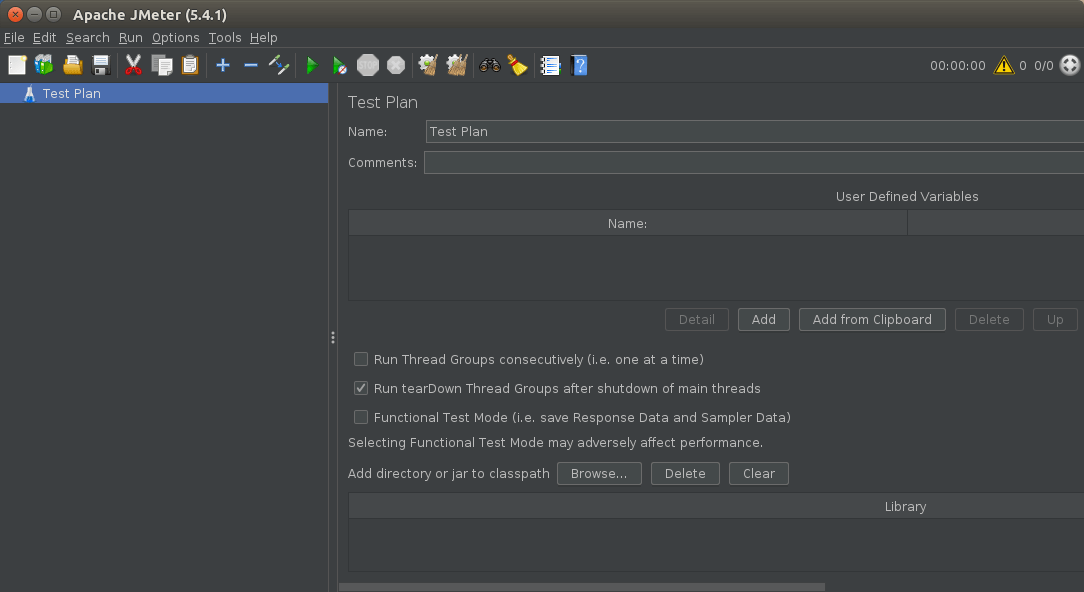
How to Use Apache JMeter
To load test your web applications, you need to
- create a test plan
- execute the test plan
Create a Test Plan
A basic test plan consists of the following elements:
- Thread Group
- HTTP Request Defaults
- HTTP Cookie Manager
- HTTP Request
- HTTP Listener
JMeter has a default test plan, which you can use if you don’t want to create multiple test plans. However, there’s no elements in the default test plan, so we need to add the missing elements.
Add Thread Group
Right-click the test plan, then select Add -> Threads (Users) -> Thread Group.
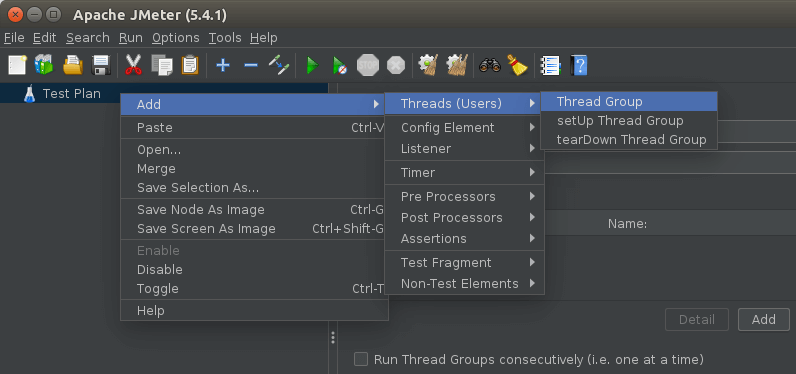
There are 3 important properties in thread group you need to modify.
- Number of threads: the number of users you want to simulate. Each thread represents a simulated user.
- Ramp-up period: the time between starting the first thread and the last thread
- loop count: how many requests each simulated users should send.
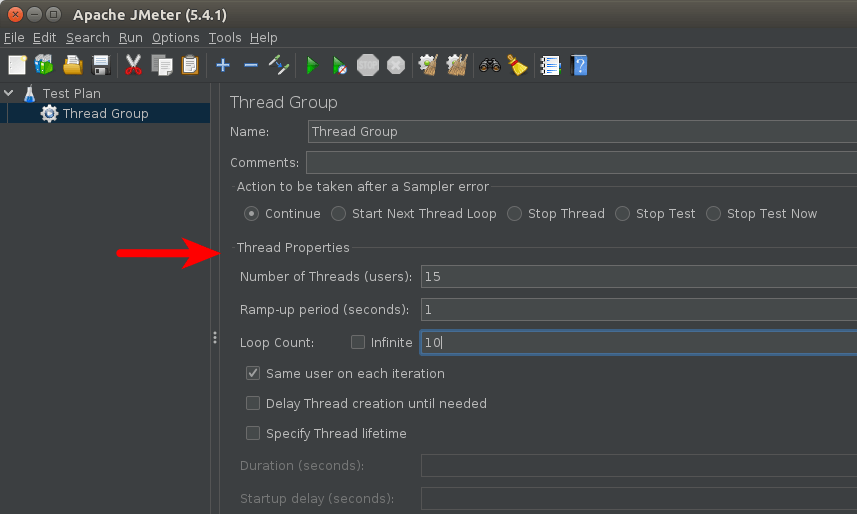
In this example, I want to simulate 15 users and each of them will send 10 requests. If you want to send requests non-stop, then select the Infinite checkbox.
Default HTTP Request Properties
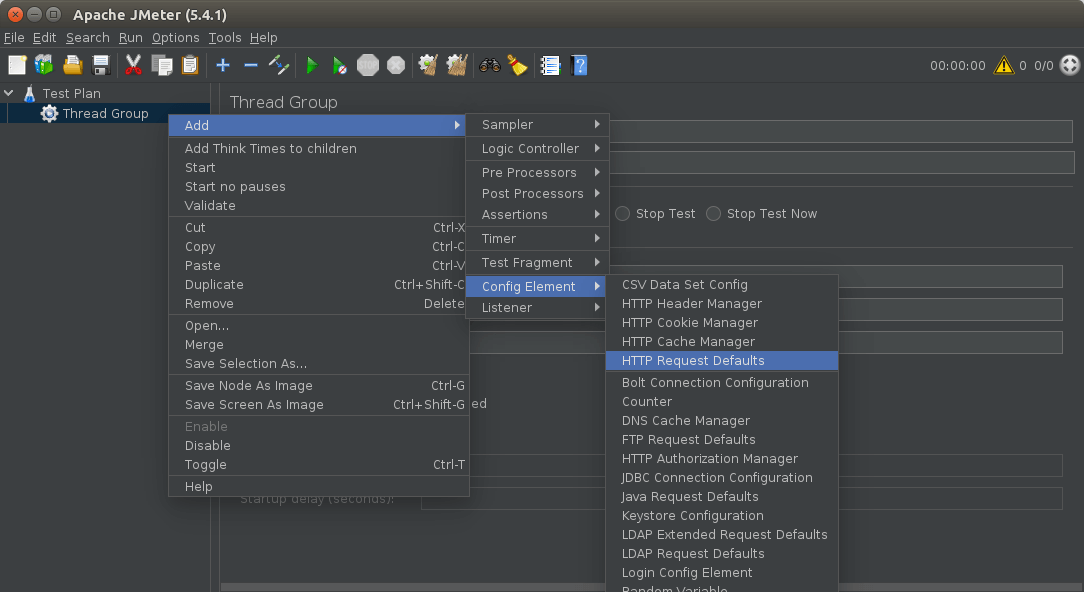
Right-click Thread Group -> Add -> Config Element -> HTTP Request Defaults.
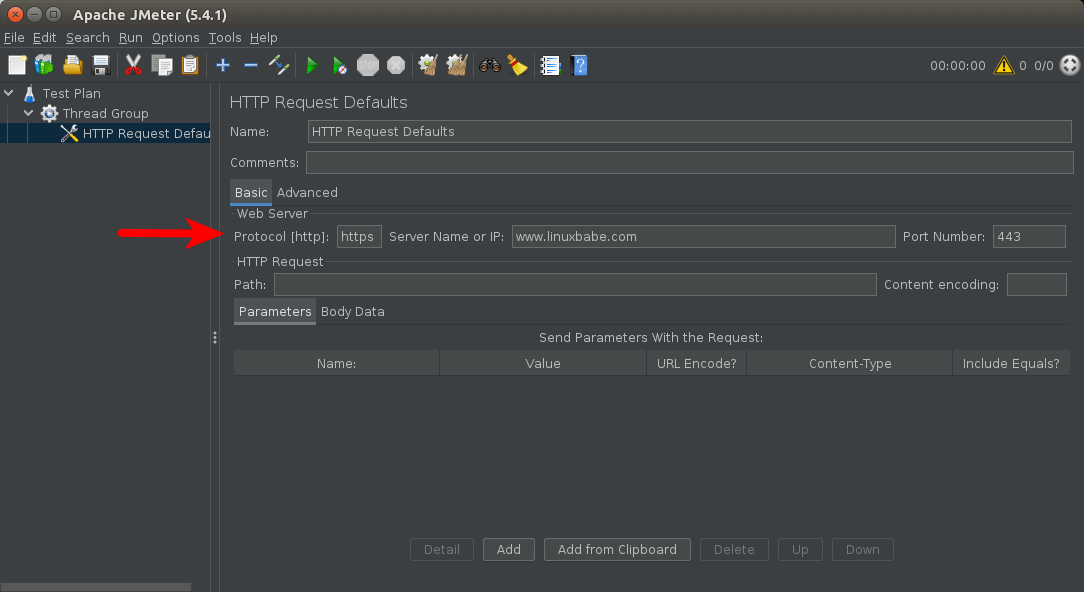
In the web server section, choose your website’s protocol (https), domain name, and port number (443).
HTTP Cookie Manager
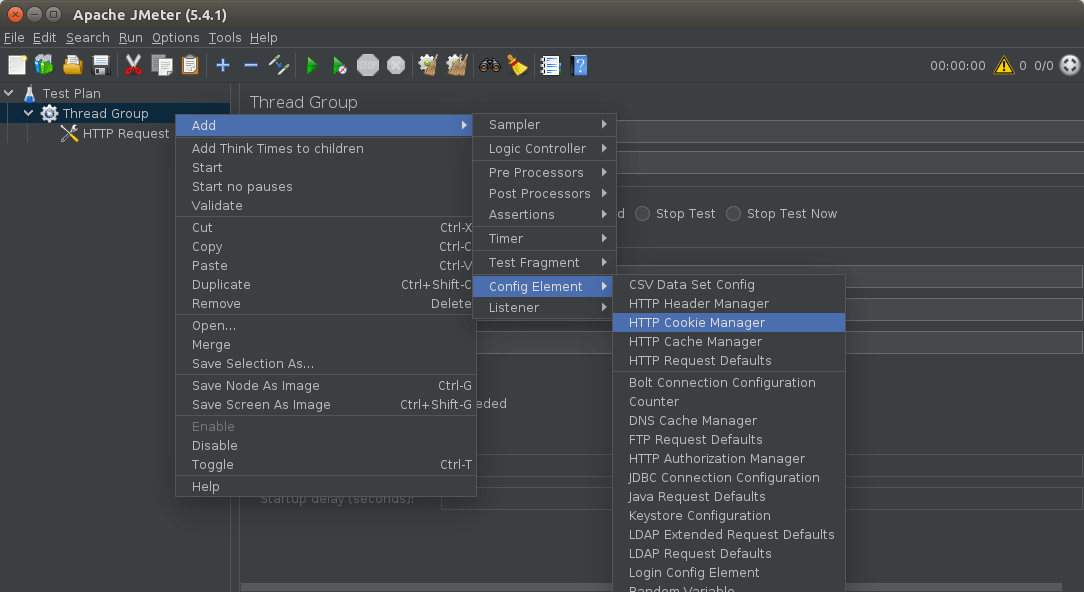
If your website generate cookies for visitors, then you should add cookie support in the thread group. Right-click Thread Group -> Add -> Config Elements -> HTTP Cookie Manager. And you are done.
Add HTTP Requests
Right-click Thread Group -> Add -> Sampler -> HTTP Request.
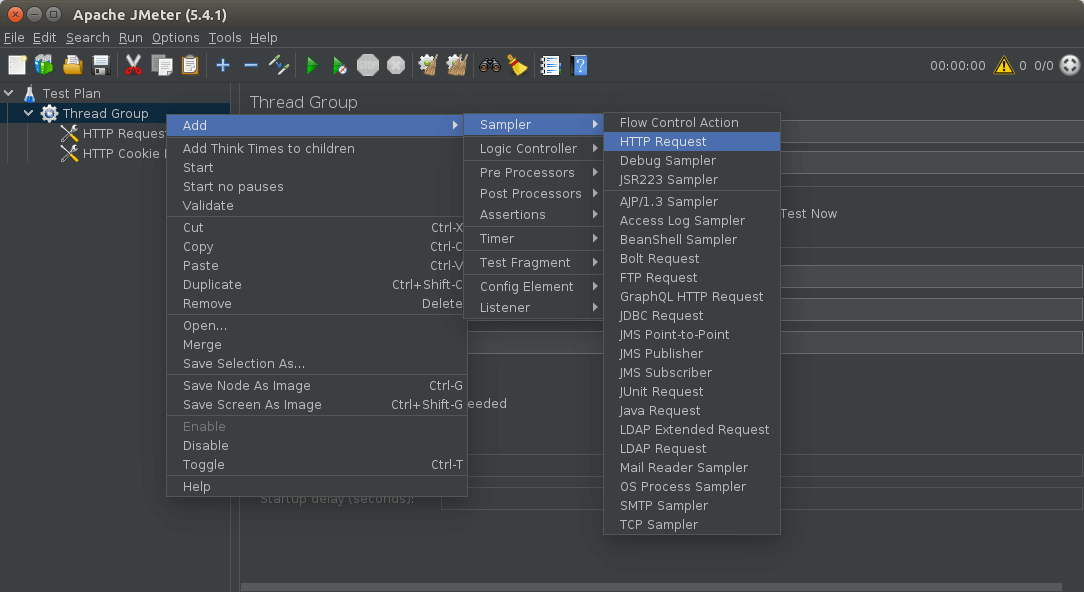
To make HTTP request to your website’s home page, set the path to /, so all simulated users will request the home page. Here you don’t need to specify the server address, because these values are already set in the HTTP Request Defaults elements.
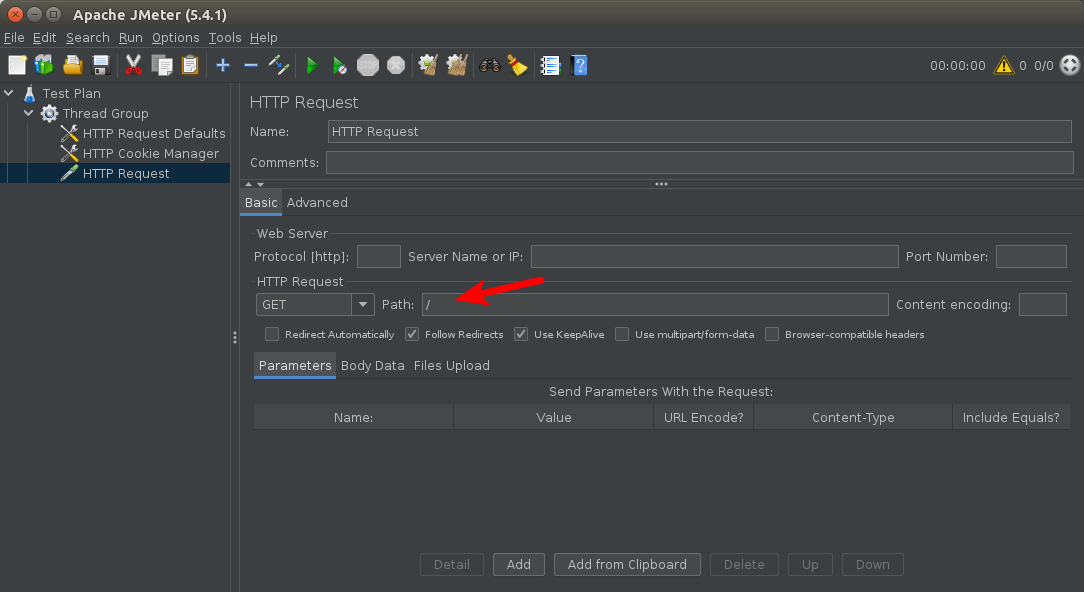
You can create multiple HTTP requests if you want to, so each simulated user will request multiple web pages.
Add a Listener
A listener in JMeter allows you to view test results and store the results to a file. Right-click Thread Group -> Add -> Listener -> Backend Listener.
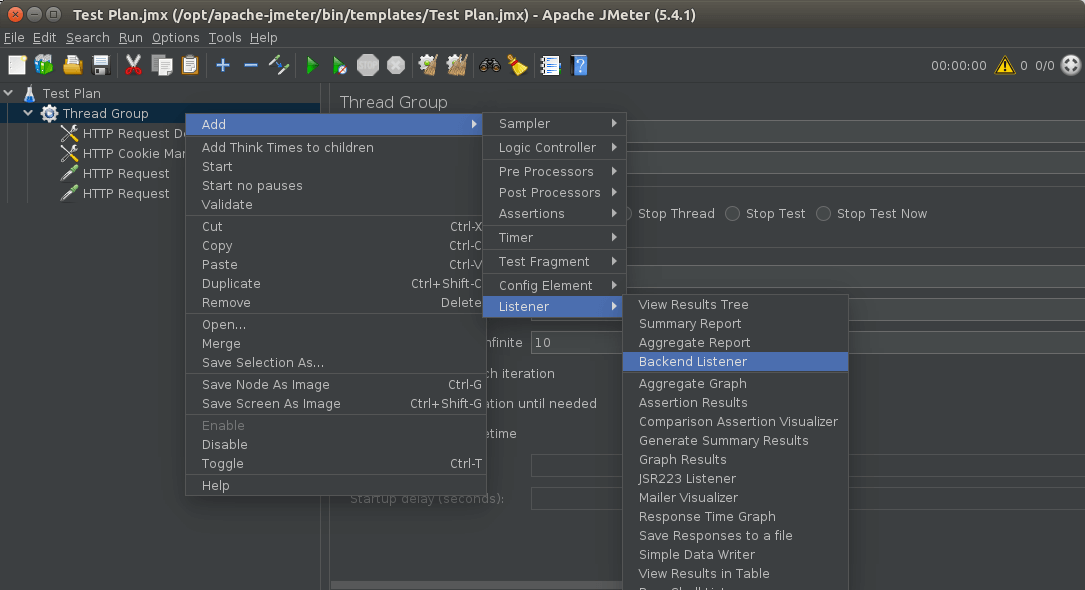
Now you can save the test plan by clicking the File menu -> Save the Test Plan as. I save it to the /opt/apache-jmeter/bin/templates/ directory.
Start Load Testing
Now close the JMeter GUI. The GUI mode should be used for test creation and test debugging. For load testing, use the command line mode.
Create a report folder.
mkdir /opt/apache-jmeter/reports/
Next, run the following command to start load testing.
/opt/apache-jmeter/bin/jmeter.sh -n -t /opt/apache-jmeter/bin/templates/Test\ Plan.jmx -l /opt/apache-jmeter/reports/testresult.jtl -e -o /opt/apache-jmeter/reports/
Where:
-n: non-GUI mode-t: test plan file-l: log file-e -o: emit report file in HTML format.

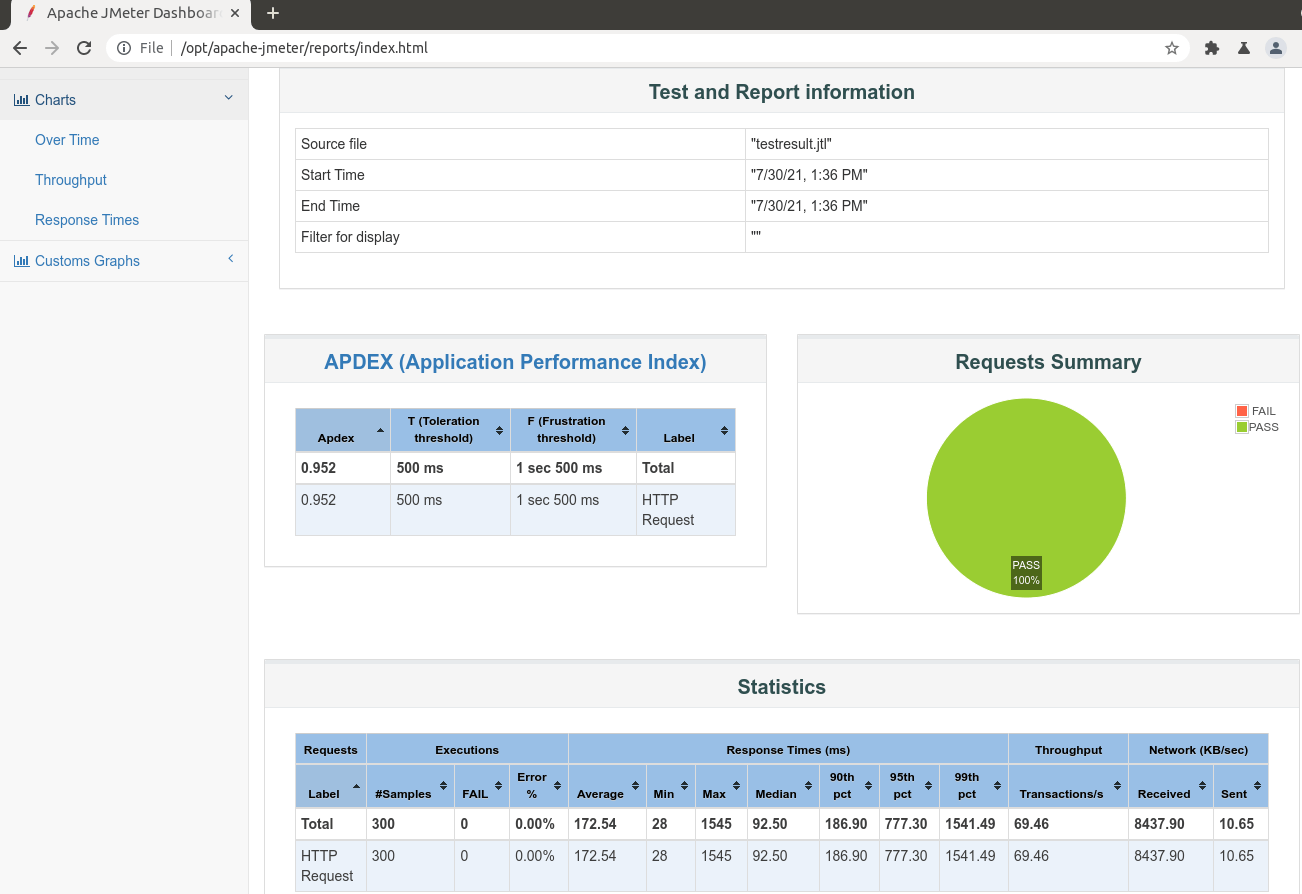
Once the test finishes, there’s HTML file in the /opt/apache-jmeter/reports/ directory.

Now you can open the index.html file in your web browser to view the load testing report.
Wrapping Up
I hope this tutorial helped you use Apache JMeter. As always, if you found this post useful, subscribe to our free newsletter to get more tips and tricks 🙂


Thanks for this tutorial, I `sudo apt install jmeter` on debian bullseye and install `jmeter v2.13-4`, my mistake. :))